Research Article - (2022) Volume 12, Issue 3
Poly aromatic hydrocarbon concentrations in some shell samples at some Tobrouk city coast regions: could the oil industry be significantly affecting the environment
H.M.A. Hasan*, H.S. Muftah, K.M. Abdelghani and S.I. SaadAbstract
Two different samples of shells were collected from some locations distributed along Toubrouk City coast (Libya). The shell samples including (Patella S.p and Monodenta S.P.). The poly aromatic hydrocarbons which obtained and detected by GC-Mass instrument in this study including (Naphthalene, Acenaphthylene, Acenaphthene, Fluorene, Phenanthrene, Anthracene, Fluoranthene, Pyrene, Benzo(a)anthracene, Chrysene, Benzo(b)fluoranthene, Benzo(k)fluoranthene, Benzo(a)pyrene, Dibenzo(a,h)anthracene, Benzo(ghi) Perylene, and indeno, (1,2,3-cd) Pyrene). The results recorded that the concentrations of PAHs in the shell samples were fluctuated as following: The contents of PHAs in the patella. Sp shell samples were ranged between (0.0024-1.5 µg/g), (0.0039-3.40 µg/g) and (0.0054- 4.11 µg/g). Whereas the contents of PAHs in Monodenta. Sp shells were ranged between (7.40 and 5.23 µg/g). The study concluded that the shell samples containing high levels of aromatic hydrocarbons which maybe indicating the contribution of the petroleum industry to these concentrations.
Keywords
Poly aromatic hydrocarbons, Petroleum, Shells, Tobruk, Libya.
Introduction
The Mediterranean Sea is subject to increasing anthropogenic pressure due to the growth of the permanent population on the Mediterranean coast, which is in the order of 150 million inhabitants, maritime traffic and industrialization, the latter still mostly confined to its northern part. As much as 200,000 commercial vessels ply the Mediterranean annually to visit one of the 305 ports therein, whereas more than 40 major refineries and petrochemical plants (UNEP, 2002) are located in the region. Therefore, it is important to understand both the origin and fate of persistent organic pollutants (POPs) in this basin.
Polycyclic aromatic hydrocarbon (PAHs) is wide-spread class of environmental chemical pollutants with mutagenic and carcinogenic properties (White, 1986) and it can accumulate in different matrices of the aquatic environment (Baumard et al. 1998; Mastral et al. 2003). Several studies have shown that PAHs can be transported from polluted areas to remote regions through atmospheric transport, which could occur as a sequence of successive volatilisation and condensation processes. In marine environments, these hydrophobic compounds with very low water solubility sorb to particulate organic matter and eventually sink to deep waters and sediments which are the final sink (Youngblood and Blumer, 1975).
PAHs are ubiquitous organic compounds that can result from natural processes such as forest fires, volcanic eruption and petroleum products, short-term degradation of biogenic precursors (diagenesis) and anthropogenic sources such as engine exhaust, industrial activities, natural gas, domestic heating system and incinerators that are considered to be the major source to the environment (Mastral et al., 2003). Natural oil seepage, oil spills and discharge of petroleum products are classified as petrogenic sources, whereas all those due to the incomplete combustion of organic matter are pyrogenic sources (Abrajano et al. 2003; Benlahcen et al., 1997; Baumard et al., 1998).
Elevated concentration of PAHs have been found in dolphins and fin whales of the Mediterranean (Marsili et al., 2001), pointing out that the accumulation of this class of pollutants in the Mediterranean food web may be dangerous. Due to their high persistence, long- range transport through both atmosphere and water and their tendency to accumulate in biota and sediments, they can be considered indicators of anthropogenic pollution (Bouloubassi et al., 2006). This manuscript aims to evaluate and determinate the contents of aromatic Hydrocarbon compounds in shell samples collected from near shore stations at Toubrok city, Libya.
Materials and Methods
Description of the studied area
The area of study extended along the coast of Tuobrok city, about 30 km between Ain zala in the east to Harbour at the west of Tobrou city to the main Harbour of city. Tobrouk city is situated in eastern north of Libya, contains harbor of petroleum (Al-Ehraiga Harbor) lies on the coast of the East Mediterranean of the coast of Libya, well-known for tourists and fisheries, receive high inputs of organic matter mostly anthropogenic. Samples locations were chosen including; the Ledo, andolous, ain gaza and stations (Fig. 1).
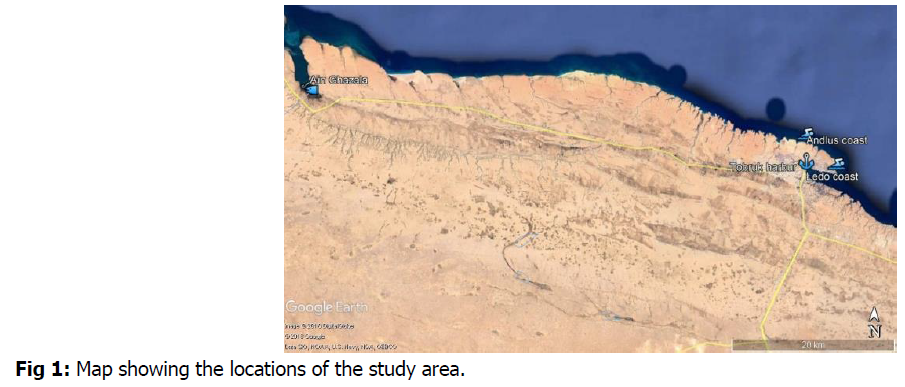
Fig 1: Map showing the locations of the study area.
Sampling and preparation of Samples
The types of shells which collected in this study included the types of: Pattela and Monodonta, the classification of the shell samples was carried in the marine science laboratory,Omar Al-Muhtar University (as shown in Fig. 2.):
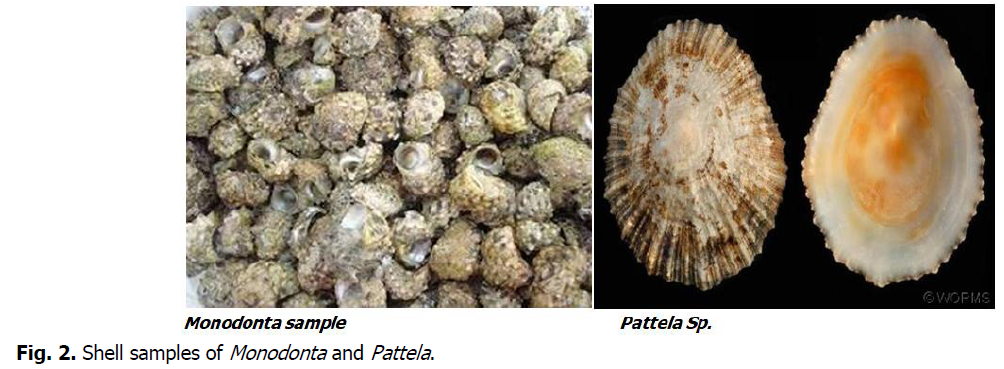
Fig 2: Shell samples of Monodonta and Pattela.
Chemical analysis
Hydrocarbons analysis
PAHs analysis (The Polycyclic Aromatic Hydrocarbons), using well-established techniques (UNEP, 1992).The determination of oil on the surface of the algae was carried out according to the following method; 100 g wet weight alga was rinsed a few second with 3 x 50 ml dichloromethane (DCM), then filtrated through a filter paper, The algal residue was separated (a) and filtrate was dryed over anhydrous sodium sulphate then distilled under vacuum, The residue was taken with hexane and the volume adjusted to 10 ml and analyzed by UV spectro fluorometry (UVF) and GCMS (UNEP, 1992). The polycyclic aromatic hydrocarbons compounds were analyzed by GC/MS, identification of each compound in algal extract was made by comparing the retention times and its spectrum with that taken from HP memory and also with the EPA standard (Alexandria, Egypt).
Extraction step of hydrocarbons for shell samples
One gram of each sample were treated with 30 g of anhydrous sodium sulfate and the mixture was blended at high speed for 5 min. Then the mixture was extracted using a soxhlet with 200 ml of methanol for 8 hrs. 20 ml of 0.7 M KOH and 30 ml of distilled water were added to the flask and the reflux was continued for 2hrs to saponify the lipids. The content of the extraction flask was extracted three times in a separating funnel with 80 ml hexane. The three extracts were combined, dried with anhydrous sodium sulfate and filtered through glass wool. The hexane fraction was concentrated with a rotary evaporator down to about 15 ml at 30°C and concentrated down to a volume of 1 ml with nitrogen gas stream and then subjected to cleaning up and fractionation (El Nemr et al., 2007).
Cleaning up and fractionation
Cleaning up and fractionation were performed by passing the concentrated extract through a silica/aluminum oxide column. The chromatography column was prepared by slurry packing 20 ml of hexane containing 10 g of silica, followed by 10 ml containing 10 g of aluminum oxide and finally 1 g of anhydrous sodium sulfate. The hydrocarbon sample extract (1 ml) was sequentially eluted from the column with 25 ml of hexane for the saturated aliphatic fraction (F1), and then 60 ml of hexane and dichloromethane (80:20) was used for the elution of the unsaturated aromatic fraction (F2). F1 and F2 were concentrated using gentle stream of nitrogen for instrumental analysis.
2 µL of each sample of unsaturated aromatic fraction was injected in the split less mode and purge time was 1 min. the response factor of individual hydrocarbon compounds to the internal standard was measured and calculated at least three times (at the beginning, in the middle, and at the end for each batch of GC injections). Identification and quantification of hydrocarbon compounds were based on matching their retention time with a mixture of hydrocarbon standards.
Calculated ratios
Some of ratios used to determine sources of aromatic compounds are represented as (R1, R2, R3, R4, R5 and R6) including the following:
R1=Inp/(Inp+Bghip), R2=Flu/(Flu+Pyr), R3=Bap/(Bap+Chr), R4=Phe/(Phe+Ant), R5=BbF/BKF and R6=Ant/(Ant+Phe)
The calculation of these ratios can be using as an indicator of the source of the aromatic hydrocarbons which detected in the samples. R1<0.4 is an indicator of petroleum pollution, however R1>0.5 is an indicator of hydrocarbon pollution originating from combusted wood and grass (Yunker et al., 2003). R2 in the range of 0.4 indicates the presence of petroleum derived hydrocarbon particles, however if higher than 0.4 this is an indicator of combusted fuel and coal R3<0.2 indicates that the aromatic components are derivatives of petroleum combustion, however if the level of R3 is between 0.4 and 0.6 this is a indicator of un-combusted petroleum pollution (Budzink et al., 1997). R4<0.1 is an indicator of aromatic compounds derived from a petro chemical source, R5>0.1 is indicator of combusted R6>0.1 indicates the presence on diesel,core oil and coal.
Ratio of low molecular weight/high molecular weight of hydrocarbons
LMW=Naphthalene+Acenaphthylene+Acenaphthene+Fluorene+Phenanthrene+Anthracene
HMW=Fluorananthene+Pyrene+B a A+ Chrysene+Bbf+ BK f+BaP+DBA+B (ghi) perylene+indenol pyrene
Computer programs
The excel and origin 0.7 (version) were used in this study, the correlation coefficient values were calculated.
Results and Discussion
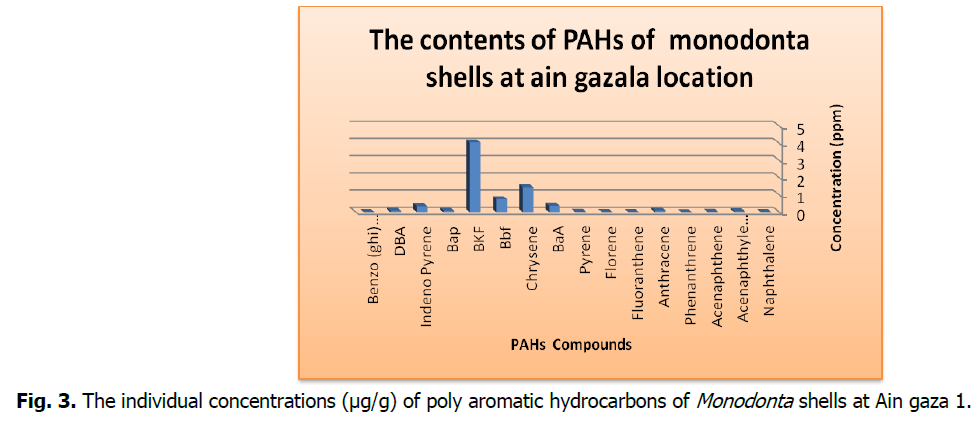
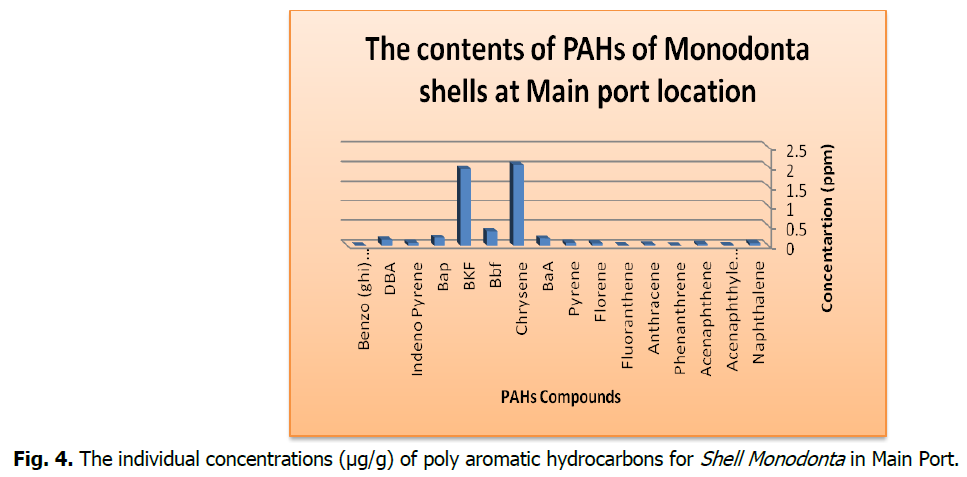
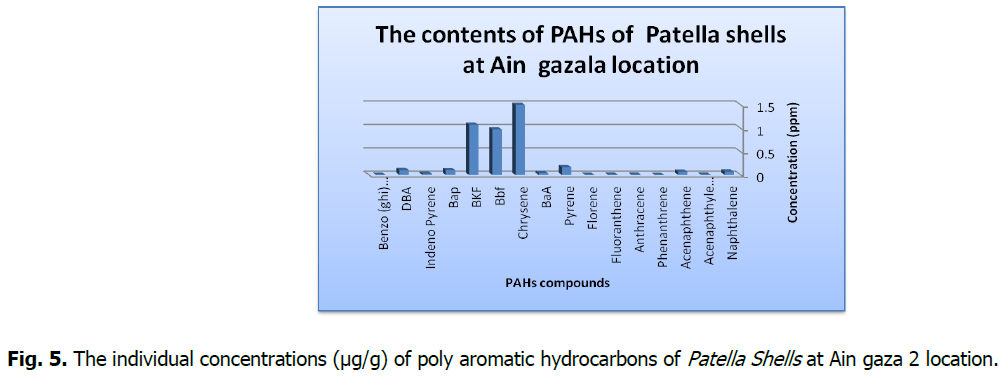
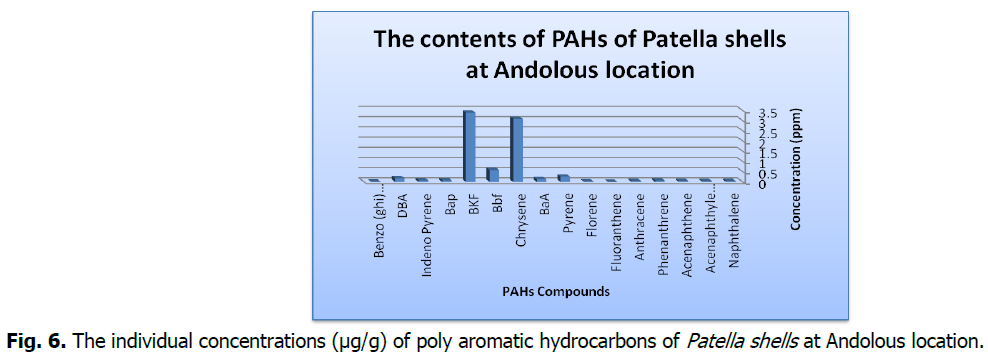
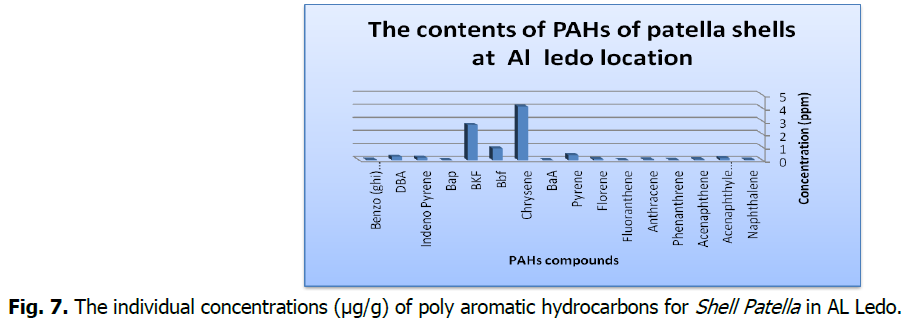
The contents of individual of (PAHs) of the studied samples were given in the Tables 1 and 2 and Fig. 3-7.
| Compound | Shell Monodonta | Total | |
|---|---|---|---|
| Ain gazala 1 | Main Port | ||
| Naphthalene | 0.0064 | 0.062 | 0.0684 |
| Acenaphthylene | 0.055 | 0.009 | 0.064 |
| Acenaphthene | 0.022 | 0.038 | 0.06 |
| Phenanthrene | 0.0039 | 0.0041 | 0.008 |
| Anthracene | 0.097 | 0.028 | 0.125 |
| Fluoranthene | 0.0046 | 0.0067 | 0.0113 |
| Fluorene | 0.0085 | 0.056 | 0.0645 |
| Pyrene | 0.025 | 0.067 | 0.092 |
| BaA | 0.367 | 0.178 | 0.545 |
| Chrysene | 1.46 | 2.06 | 3.52 |
| Bbf | 0.760 | 0.37 | 1.13 |
| BKF | 4.06 | 1.94 | 6 |
| Bap | 0.098 | 0.20 | 0.298 |
| Indeno Pyrene | 0.344 | 0.067 | 0.411 |
| DBA | 0.090 | 0.145 | 0.235 |
| Benzo (ghi) perylene | 0.0068 | 0.0054 | 0.0122 |
| TOTAL (PAHs) | 7.4082 | 5.2362 | 12.6444 |
Table. 1. The aromatic hydrocarbons in the Marine Shell (Monodonta) samples in areas (Chief Port, Ain gaza1).
| Compounds | Shell Patella. | Total | ||
|---|---|---|---|---|
| Ain gazala 2 | Andolous | AL Ledo | ||
| Naphthalene | 0.072 | 0.047 | 0.038 | 0.157 |
| Acenaphthylene | 0.008 | 0.038 | 0.154 | 0.2 |
| Acenaphthene | 0.071 | 0.049 | 0.053 | 0.173 |
| Phenanthrene | 0.0024 | 0.07 | 0.017 | 0.0894 |
| Anthracene | 0.008 | 0.047 | 0.046 | 0.101 |
| Fluoranthene | 0.0081 | 0.0039 | 0.0049 | 0.0169 |
| Fluorene | 0.0035 | 0.023 | 0.078 | 0.1045 |
| Pyrene | 0.167 | 0.26 | 0.397 | 0.824 |
| BaA | 0.04 | 0.127 | 0.0054 | 0.1724 |
| Chrysene | 1.5 | 3.09 | 4.11 | 8.7 |
| Bbf | 0.98 | 0.58 | 0.9 | 2.46 |
| BKF | 1.08 | 3.4 | 2.7 | 7.18 |
| Bap | 0.107 | 0.08 | 0.008 | 0.195 |
| Indeno Pyrene | 0.028 | 0.078 | 0.19 | 0.296 |
| DBA | 0.11 | 0.18 | 0.267 | 0.557 |
| Benzo (ghi) perylene | 0.007 | 0.009 | 0.038 | 0.054 |
| TOTAL (PAHs) | 4.192 | 8.0819 | 9.0063 | 21.2802 |
Table. 2. Show the results of aromatic hydrocarbons in the Marine Shell (Patella.) samples in areas (Ain gaza2, Andolous and AL Ledo).
Fig 3: The individual concentrations (μg/g) of poly aromatic hydrocarbons of Monodonta shells at Ain gaza 1.
Fig 4: The individual concentrations (μg/g) of poly aromatic hydrocarbons for Shell Monodonta in Main Port.
Fig 5: The individual concentrations (μg/g) of poly aromatic hydrocarbons of Patella Shells at Ain gaza 2 location.
Fig 6: The individual concentrations (μg/g) of poly aromatic hydrocarbons of Patella shells at Andolous location.
Fig 7: The individual concentrations (μg/g) of poly aromatic hydrocarbons for Shell Patella in AL Ledo.
The correlation matrix of the PAHs contents of patella shells was calculated and given in Table 3.
| Ain gaza 2 | Andolous | AL Ledo | |
|---|---|---|---|
| Ain gaza 2 | 1 | - | - |
| Andolous | 0.9399 | 1 | - |
| AL Ledo | 0.9073 | 0.714 | 1 |
Table 3. Correlation coefficients between region Ain gaza 2, Andolous and AL-Ledo of Shell Patella.
Discussion
Poly aromatic hydrocarbons (PAHs)
The concentrations of speciation's and ∑PAHs in the studied samples are shown in Table 1 and 2 and represented in Fig. 3-7, the results showed variations between the contents of the PAHs in the studied shell Species.
The poly aromatic hydrocarbons which obtained and detected by GC-Mass instrument in this study including (Naphthalene, Acenaphthylene, Acenaphthene, Fluorene, Phenanthrene, Anthracene, Fluoranthene, Pyrene, Benzo(a)anthracene, Chrysene, Benzo(b)fluoranthene, Benzo(k)fluoranthene, Benzo(a)pyrene, Dibenzo(a,h)anthracene, Benzo(ghi)Perylene, andindeno, (1,2,3-cd)Pyrene).
The concentrations of PAHs in the were fluctuated as following: the contents of PHAs in the patella shell samples were fluctuated in the ranges of (0.0024-1.5 µg/g), (0.0039-3.40 µg/g) and (0.0054-4.11 µg/g) at the locations of Ain Gazala, Al Andalous and Al Ledo locations, respectively. Whereas the contents of PAHs in Monodenta shells were as following: (7.40 and 5.23 µg/g) for the locations of Ain Gazala and Main port, respectively.
The joint FAO/WHO expert committee on food additives (Simko, 2004), has developed a notification that concentration of Bap should be not exceed the limit of 10 µg/g, This value is higher than those values which obtained in present study i.e., ranged between (0.008-0.107 µg/g) and (0.090-0.20 µg/g) for patella and Monodonta, respectively. The concentrations of carcinogenic Benz(a) pyrene was also low in all studied samples.
It was stated that the physical and chemical properties of some PAHs, like chemical reactivity (photo-oxidation and oxidation) can contribute to modify the original distribution pattern of emission sources. In marine ecosystems, PAHs can undergo degradation by photo-oxidation in superficial water layer (Mill et at., 1981).
The present study suggests that the values of PAHs were 0.08985, 0.3072 and 0.5775 µg/g, is to some extent safe and will have weak. but not harmful, effect on marine organisms. This is in accordance with reported conclusion (Mazmanidi at al., 1976) who stated that the total hydrocarbons concentration in marine which can produce a harmful effect on the aquatic organisms is about 50 µg/l. The present investigation briefly concludes that the sources of PAHs in the studied area are mainly from incomplete combustion at high temperatures of recent and fossil organic matter (Pyrolyric origin) with little evidence of petrogenic origins. Atmospheric deposition, industrial discharges and land runoff waters are the main Factors responsible for pyrolytic PAHs (Djomo et al., 2006). (Hwang et al., 2003), found that the high partitioning of PAHs to sedimentary organic matter was mainly due to the significant aromatic fraction of the organic matter, They considered the sedimentary organic matter as a natural "heterogeneous polymer" where PAHs interact more favorably with the aromatic regions.
Various PAHs concentration diagnostic ratios have been used to identify and quantify the contribution of each source of pollution to the specified environmental regions (Krom et at., 1989), Fluoranthene/pyrene (Fluo/Pyr) ratio indicated the origin of PAHs.
If the ratio of (flu/pyr) was <1 was attributed petrogenic sources and if the ratio of (flu/pyr) >1 is related to pyrolytic origin(Sicre et al., 1997), Combustion of coal and wood gave (Fluo/pyr) ratios of 0.013 and 0.042, respectively. while crude oil and fuel oil had values of 0.6-0.9 (Gschwend and Hites 1981). In the present study, all sites had (Fluo/Pyr), ratio <1 reflecting petrogenic origin. The ratio of major combustion specific compounds ∑COMB=(Flu, Pyr, BaA, Chr, BbF, BkF, BaP, InP and BghiP) to the sum of total PAHs (∑COMB/∑PAHs) were (0.153, 0.136, 0.078, 0.092) of the Algae (Laurencia sp. Coralline sp. and Cladophara sp.), respectively in study Areas(Chief Port and AL Ledo) and the ∑COMB concentrations displayed values (0.137, 0.069, 0.172), for (Laurencia sp.,, Coralline sp.,Cladophara sp.), respectively.
The estimated diagnostic isomeric ratios of PAHs should be cautiously used due to the interaction of physical and biogeochemical processes which may alter PAH profiles during processes of transport and flux. The fingerprints of PAHs from pyrolytic or petrogenic origin may be used to differentiate these origins using molecular indices based on ratios of selected isomers of PAH concentrations (Colombo et al., 1989).
Origin of PAHs in the marine samples
The difficulty in the identifying of PAHs origins come from the possible coexistence of many contamination sources, and the information processes that PAHs can undergo in the air, water or wastes before deposition in the analyzed sediments. Some compounds could exhibit comparable evolution kinetics that could be used to identify the origin of organic matter in the environment (Colombo et al., 1989). The distributions of aromatic compound differ according to the sources of production (port, 1993), and, chemical composition and temperature combustion of the organic matter (Neff, 1979). Pyrene. phenanthrene and benzo(b)fluoranthene are components of fossil fuels and a portion of them is associated with their combustion. Benzo(a)pyrene is usually emitted from catalyst and non-catalyst and automobiles. Benzo(a)anthracene and chrysene are often resulted from combustion of both diesel and natural gas (Rogge et al., 1993).
The sources of PAHs can also be identified by the ratios of individual PAH compounds based oil peculiarities in PAH composition and distribution pattern as a function of the emission source (Gschwend and Hites. 1981; Colombo et al., 1989), if the source is from fuel-combustion it named pyrolytic and if it is from crude oil it named petrogenic contamination. Ratio values such as phenanthrene/anthracene (Phe/Ant) and fluoranthrene/pyrene (Flu\Pyr) had been used by previous workers (Soclo et al., 2000; El Sikaily et al., 2002; El Nemr and Abd-Allah 2003, EI Nemr et al., 2007 and 2008), Petroleum often contains more phenanthrene relative to anthracene as phenanthrene that is more a thermodynamically stable tricyclic aromatic isomer than anthracene. So a Phe/Ant ratio is observed to be very high in PAH petrogenic pollution, but low ratio in pyrolytic contamination cases (Gschwend and Hites, 1981; 2000; Yang 2000).
Crude oil had a Phe/Ant ratio of around 50, and motor vehicle exhaust had a ratio of around four (Yang et al., 2008), Low Phe/Ant ratio values (less than 10) indicated the major PAH input was from combustion of fossil fuel (Gschwend and Hites, 1981; Colombo et a1., 1989), (Budzinski et al., 1997) suggested that sediments with Phe/Ant>10 were mainly contaminated by petrogenic inputs and Phe/Ant<10 was typical of pyrolytic sources. In the present study, the ratio of individual PAHs compounds varied between Algae samples, and between water samples indicating that the sources of PAHs contamination might be different, Low Phe/Ant ratios (<10) were found in all locations in Algae samples (Table 4) suggesting that they were pyrolytic-derived PAHs. However. the different Phe/Ant ratio values might be related to weathering such as photo-degradation, chemical degradation or biodegradation and also the composition (for Algae samples), the (Flu/pyr), can indicted the origin of PAH since (Sicre et al., 1987), in the present study, most samples had (Flu/Pyr), ratio values less than 1 However, the results obtained from the Phe/Ant and Flu/Pyr ratios, indicated a mixed pattern of petrogenic and pyrolytic contamination at most tissues samples.
| Ratio Station |
(Fluo/Pyr) | ΣCOMB | ΣCOMB/PAHs | (Phe/Ant) | ΣPAHCARC | (LMW/HMW) |
|---|---|---|---|---|---|---|
| Ain Gazala | 0.34 | 7.12 | 0.96 | 0.40 | 4.95 | 0.027 |
| Main Port | 0.83 | 4.94 | 0.94 | 0.14 | 2.63 | 0.028 |
Table. 4. The diagnostic ratios of poly aromatic hydrocarbons in the Monodonta shell samples.
The low molecular weight/high molecular weight ratio
Table 4 showing the ratio of low molecular weight/high molecular weight compound (Lipiatou,1997), suggesting that the low molecular weight represent by polyaromtic hydrocarbons compound that have (2-3) rings and high molecular weight represent by polyaromtic hydrocarbons compound that have (4-5) rings.
The ratio of (LMW/HMW)
(Naphthalene+Acenaphthylene+Acenaphthene+Fluorene+Phenanthrene+Anthracene/Fluoranthene+Pyrene+Benzo(a)anthracene+Chrysene+Benzo(b)fluoranthene+Benzo(k)fluoranthene+Benzo(a)pyrene+Dibenzo(a,h)anthracene+Benzo(ghi)Perylene+ndeno(1,2,3-cd)Pyrene), this ratio in all station for both shells and Algae samples was <1 that indicate to the source of TPAHs from pyrolytic origin. Except from that sites 1 in water samples and sites 3 in Algae samples has ratio of (LMW/HMW) was >1 that indicate to the source of TPAHs related to ptrogenic origin (Garrigueset et al.,1993). The diagnostic ratios of poly aromatic hydrocarbons of shell samples were shown in Table 4 and 5.
| Ratio Station |
(Fluo/Pyr) | ΣCOMB | ΣCOMB/PAHs | (Phe/Ant) | ΣPAHCARC | (LMW/HMW) |
|---|---|---|---|---|---|---|
| Ain Gazala | 0.020 | 3.91 | 0.933 | 0.30 | 2.34 | 0.042 |
| Al andlous | 0.088 | 7.64 | 0.945 | 1.48 | 4.34 | 0.031 |
| Aledo | 0.205 | 8.40 | 0.880 | 0.369 | 4.09 | 0.035 |
Table. 5. The diagnostic ratios of poly aromatic hydrocarbons in the Patella shell samples.
Other six diagnostic ratios between individual PAHs concentrations were calculated and used to make the identification of the PAHs origin more precisely R-l=InP\(lnP+BghiP); R-2=Flu/(Flu+Pyr); R-3=BaP/(BaP+Chr); R-4=Phe\(Phe+Ant), R-5=BbF\BkF and R-6=Ant\(Ant+Phe) (Dickhut et al., 2000).
R-1 ratio is less than 0.4 for petroleum and >0.5 for petroleum/combustion mixture. Literature values of R-1 ratio are above 0.5 for grass combustion, wood soot and creosote (Yunker et al., 2002), R-3 ratio values are less than 0.2 for combustion and between 0.6 and 0.9 for petroleum while ratios between 0.1 and 0.6 are due to petroleum/combustion mixture. R-6 ratio <0.1 usually is taken as an indication of petroleum while a ratio>0.1 indicates a dominance of combustion (Budzinski et al., 1997), R-6 ratios >0.1 represent the combustion of diesel oil. shale oil, coal and some crude oil samples. R-2 ratio of 0.4 is usually defined as the petroleum. while ratio or 0.5 is for petroleum\combustion transition point (Budzinski et al., 1997), however, this boundary appears to be less definitive than 0.1 for R-6.
Generally, R-2 ratio is below 0.4 for most petroleum samples and above 0.5 in kerosene, grass. most coal and wood combustion samples and creosote, but ratios between 0.4 and 0.5 is characteristic for liquid fossil fuel such as gasoline, diesel, fuel oil and crude oil combustion find emissions from cars and diesel trucks.
When applying the results obtained from the above ratios, (Table 6 and 7) gave three groups indicating three sources; the first represents the samples of petrogenic sources, the second group represents the stations of pyrolytic sources (most ratios in the studied samples) and the third group represents the stations of a mixture of petrogenic and pyrolytic source (Yang, 2008),the same ratios were calculated for the studied shell samples and given in below Tables:
| Ratio Station |
R1 | R2 | R3 | R4 | R5 | R6 |
|---|---|---|---|---|---|---|
| Ain Gazala | 0.98 | 0.07 | 0.93 | 0.039 | 0.187 | 0.096 |
| Al andlous | 0.93 | 0.45 | 0.080 | 0.128 | 0.190 | 0.87 |
Table. 6. The ratios of (R1-R6) of Mondonta shell samples at sme locations.
| Ratio Station |
R1 | R2 | R3 | R4 | R5 | R6 |
|---|---|---|---|---|---|---|
| Ain Gazala | 0.80 | 0.020 | 0.071 | 0.24 | 0.90 | 0.80 |
| Al andlous | 0.91 | 0.081 | 0.025 | 0.59 | 0.17 | 0.40 |
| Al-ledo | 0.86 | 0.164 | 0.001 | 0.26 | 0.33 | 0.73 |
Table. 7. The ratios of (R1-R6) of the Patella shell samples.
Conclusion
According to the obtained results which recorded in this study about the distribution and origin of the hydrocarbons in the studied samples.Different types and compounds of aromatic hydrocarbons were detected in the selected samples (Shells) the results showed that there are relative variations of the hydrocarbon compounds from location to location mainly depend up the origin of these compounds. Generally the sources of hydrocarbon compounds of the studied are mainly due to the petrogenic and perolytic sources.
References
Abrajano, T.A., Yan, B., O’Malley, V. (2003). High molecular weight petrogenic and pyrogenic hydrocarbons in aquatic environments. In B. Sherwood Lollar (Ed.), Environmental Geochemistry, Treatise on Geochemistry, 9:475-509).
Baumard, P., Budzinski, H., Garrigues, P. (1998). Polyciclic aromatic hydrocarbons in sediments and mussels of the western Mediterranean Sea. Environmental Toxicology and Chemistry, 17:765-776.
Benlahcen, K.T., Chaoui, A., Budzinski, H., Bellocq, J., Garrigues, P.H. (1997). Distribution and sources of polycyclic aromatic hydrocarbons in some Mediterranean coastal sediments. Marine Pollution Bulletin, 34:298-305.
Bouloubassi, I., Méjanelle, L., Pete, R., Fillaux, J., Lorre, A., Point, V. (2006). Transport by sinking particles in the open Mediterranean Sea: a 1 year sediment trap study. Marine Pollution Bulletin, 52:560-571.
Budzinski, I.l., Jones, J., Bellocq, J., Pierard. C., Garrigues, P. (1997). Evaluation or sediment contamination by polycyclic aromatic hydrocarbom in the Gironde esturary. Marine Chemistry, 58:85-97.
Colombo, J.C., Pelletier, F., Bronchu, C., Khalil M., Cataggio, J.A. (1989). Determination of hydrocarbon sources using n-alkanes and polyaromatic distribution indices. Case study: Rio de Ia Plata estuary, Argentina. Environmental Technology, 23:888-894.
Djomo, J.E., Garrigues, P., Narbonne, J.E. (2006). Uptake and depuration of polycyclic aromatic hydrocarbons from sediment by the zebrafish (Bracydanio rerio). Environmental and Toxicology Chemistry, 15:1177-1181.
El Nemr, A., Tarek, O.S., Khaled, A., El-Sikaily, A., Abd-Allah, A. (2007). The distribution and sources of polycyclic aromatic hydrocarbons in surface sediments along the Egyptian Mediterranean coast. Environmental Monitoring and Assessment, 124:343-359.
Garrigues, P., Narbonne, J.F., La Faurie, M., Ribera, D., Lemaire, P., Raoux, C., Michel, X., Salaun, J.P., Monod, J.L., Romeo M. (1993). Banking of environmental samples for short-term biochemical and chemical monitoring of organic contamination in coastal marine environments. The GICBEM. Experience (1986-1990). Science Total Environment, 140:225-236.
Gschwend, P.M., Bites, R.A. (1981). Fluxes of polycyclic aromatic hydrocarbons to marine and lacustrine sediments in the northeastern United States. Geochimica et Cosmochimica Acta, 45:2359-2367.
Hwang, H.M., Wade, T.L., Sericano, J.L. (2003). Concentrations and source characterization or polycyclic aromatic hydrocarbons in pine needles from Korea, Mexico, and United States, Atmosphere Environment, 37:2259-2267.
Lipiatou, E., Tolosa, I., Simo, R., Bouloubassi, I., Dachs, J., Marti, S., Sicre, M.A., Bayona, J.M., Grimalt, J.O., Saliot, A., Albaiges, J. (1997). Mass budget and dynamics of polycyclic aromatic hydrocarbon in the Mediterranean Sea. Deep-Sea Research Part II, 44:881-905.
Lodovici, M., Venturini, M., Marini, E., Grechi, D., Dolara, P. (2003). Polycyclic aromatic hydrocarbons air levels in Florence, Italy. and their correlation with other air pollutants. Chemosphere, 50:377-382.
Neff, J.M. (1979). Polycyclic aromatic hydrocarbons sources fates and biological effects. London: Applied Science.
Porte, C., Albaigés, J. (1993). Bioaccumulation patterns of hydrocarbons and polychlorinated biphenyls in bivalves, crustacean and fishes. Archives of Environment Contamination and Toxicology, 26:273-281.
Rogge, W.E., Hildemann, L., Mazurek, M.A., Cass, G.R., Si-moneit, B.R.T. (1993). Sources of fine organic aerosol: 2. Noncatalyst and catalyst-equipped automobiles and heavy duty diesel trucks. Environmental Science and Technology, 27:636-651.
Sicre, M.A., Bayona, J.M., Grimalt, J.O., Saliot, A., Albaiges, J. (1997). Mass balance and dynamics of polycyclic aromatic hydrocarbons in the Mediterranean Sea. Deep-Sea Research, 44:881-905.
Sicre, M.A., Marty, J.C., Saliot, A., Aparicio, X., Grimalt, J., Albaiges, J. (1987). Aliphatic and aromatic hydrocarbons in different sized aerosols over the Mediterranean Sea: occurrence and origin. Atmospharic Environment, 21:2247-2259.
Simko, P., Anyakora, C., Ogheche, A., Palmer, P., Coke, H. (2004). Determination of polynuclear aromatic hydrocarbons in marine samples of Siokola fishing settlement. Journal of Chromatography A, 2:21-28.
UNEP (United Nations Environment Programme Chemicals). (2002). Mediterranean regional report. Regionally Based Assessment of Persistent Toxic Substances.
White, K.L. (1986). An overview of immunotoxicology and carcinogenic polycyclic aromatic hydrocarbons. Environmental Carcinology Reviews, 2:163-202.
Yunker, G.P. (2003). Polycyclic aromatic hydrocarbons in sediment of south China sea. Environmental Pollution, 108:163-171.
Youngblood, W.W., Blumer, M. (1975). Polycyclic aromatic hydrocarbons in the environment: homologous series in soils and recent marine sediments. Geochimica et Cosmochimica, pp:1303-1313.
Author Info
H.M.A. Hasan*, H.S. Muftah, K.M. Abdelghani and S.I. SaadCitation: Hasan, H.M.A., Muftah, H.S., Abdelghani, K.M., Saad, S.I. (2022). Poly aromatic hydrocarbon concentrations in some shell samples at some Tobrouk city coast regions: could the oil industry be significantly affecting the environment. Ukrainian Journal of Ecology. 12:21-28.
Received: 15-Feb-2022, Manuscript No. UJE-22-54448; Accepted: 10-Mar-2022, Pre QC No. P-54448; Editor assigned: 18-Feb-2022, Pre QC No. P-54448; Reviewed: 24-Feb-2022, QC No. Q-54448; Revised: 02-Mar-2022, Manuscript No. R-54448; Published: 18-Mar-2022, DOI: 10.15421/2022_350
Copyright: This is an open access article distributed under the terms of the Creative Commons Attribution License, which permits unrestricted use, distribution, and reproduction in any medium, provided the original work is properly cited.

