
Research - (2021) Volume 11, Issue 3
Minimization of environmental risks in crops cultivation
А.P. Burliai*, O.L. Burliai, Yu.О. Nesterchuk, I.I. Cherneha, S.Yu. Sokoliuk and A.A. OsipovaAbstract
Environmental risks are urgent problems of today that require an immediate search for ways to minimize them. The leading cause of environmental risks is the anthropogenic factor associated with the economic development of society. Critical is the study of risks in agricultural production, on the development of which depends on the country's food security. This is because agricultural activities are closely intertwined with natural and climatic conditions. At the same time, agricultural enterprises also harm the environment, resulting in catastrophic climate change. The main environmental risks of agricultural production are identified: non-compliance with environmental standards; the emergence of epidemiological threats; risks of unfavorable natural and climatic conditions in the form of floods, fires, snow elements, and avalanches, icing, and risks of soil erosion (landslides); use of plant protection products; use of GMOs, reduction of production productivity through the introduction of environmental processes. One way to minimize environmental risks in agriculture is to optimize the structure of sown areas of crops. A model for optimizing an economic problem with two linear objective functions and a linear system of constraints is developed. The model contains a compromise solution on two indicators (gross output at comparable prices in 2016 (in order to reduce inflation) and the accumulation of carbon dioxide by cereals in terms of humidification subzones of the Forest-Steppe. Implementation of the optimization problem results will allow increasing the economic and environmental effects of grain production without unnecessary investments. Thus, the increase in the value of gross output in the region with specialization of grain production is 869,030 thousand UAH, and at the same time, the growth of CO2 accumulation in the amount of 3,714,918 tons, and taking into account the livestock industry to optimize the structure of grain crops can get an additional 477,297 thousand UAH VP and 1989363 tons of CO2.
Keywords
risks, ecologization of production, climate change, environmental risks, agricultural production.
Introduction
Today's global challenge is the greenhouse effect, the emergence of which is directly related to the anthropological activities of people. The Kyoto Protocol (1997) and the Paris Agreement (2015) demonstrate humanity's deep concern about this problem and the search for ways to solve it.
The increase in the greenhouse effect directly correlates with climate change on the planet, with the melting of glaciers, rising water levels in the world's oceans, and temperatures at the poles. The cause of this phenomenon is the growth of carbon dioxide emissions into the atmosphere. Thus, over the last century, the share of carbon dioxide in the atmosphere has increased from 0.03% to 0.04%. This inevitably leads to global warming and its consequences. In recent years, global carbon dioxide emissions are at the level of 35,699,000 thousand tons per year, among which the share of Ukraine is 205,000 thousand tons. Most greenhouse gas emissions remain in the energy, agriculture, and waste sectors and their processing and transport infrastructure. To avoid a global catastrophe, reducing carbon emissions to 2 billion tons per year is necessary.
To find ways to reduce carbon emissions, it is essential to identify the main reasons that lead to this:
giving preference to fossil energy sources (coal, oil, natural gas);
rapid growth in the number of vehicles - mobile sources of carbon dioxide emissions;
deforestation and forest fires;
increase in waste, including and in the field of animal husbandry;
unreasonable use of fertilizers and plant protection products.
Among the reasons for the increase in carbon dioxide emissions are those directly related to the agricultural sector - forestry, agriculture, and animal husbandry. According to the State Statistics Service of Ukraine, carbon dioxide emissions in the agricultural sector from stationary sources alone amount to 11,622 thousand tons.
Problems of agricultural risk are the subject of research by many domestic and foreign researchers. This is primarily due to the specifics of the industry. Summarizing the work of scientists, we can identify an extensive classification of risks of agricultural production, the study of which will help minimize them (Hęćka, Łyskawa, 2016; Komarek et al., 2020; Komarek, 2020; Meuwissen, Dijkhuizen, 2001; Burliai, 2021). However, in recent years, environmental risks, which have become the goal of our study, have become much more acute.
Environmental risks are one of the most pressing issues threatening equilibrium. These include the protection of water resources, the impact on human health, the concern for biodiversity, and the quality of the environment.
When determining environmental risks, two factors must be considered: the occurrence of the event and the consequences. Depending on who is the initiator of the risk, environmental risks are divided into:
1) risks caused by man, the so-called anthropogenic - the introduction of chemicals into the environment, increasing waste, destruction of biota;
2) risks posed by "nature itself" due to natural processes - floods, volcanic eruptions, natural fires, and other natural disasters.
The most discussed are the risks associated with economic development, which makes them a constant threat to society and the environment. These are the risks associated with industrialization, urbanization, agricultural development, and last, but not least, the constant growth of the human population on Earth. These risks are observed, especially in developed countries, and the paradox is that they also increase with the country's economic growth.
In poorer countries, environmental risks are mainly related to malnutrition, poor hygiene, housing.
Among the most frightening and discussed priority environmental risks monitored today and in the future are: risk of soil degradation, risk of tropical land cover, risk of deteriorating air quality, risk of deteriorating water quality, risk of eutrophication in inland waters, risk of climate change (especially climate variability, global weather, sunlight, climate change, atmospheric ozone), marine pollution of the oceans - oil (oil pollution, tanker accidents), the risk of natural disasters (tropical cyclones, tsunamis, floods), the risk insufficient water supply (lack of drinking water), risk of mass extinction, risk of fires, risk of desertification (spread of semi-deserts), risk of destruction of soil, forests and wildlife, risk of disposal of industrial and toxic waste, risk of harm to the human population (mutagenic damage to the population, genotoxic risks due to exposure to chemicals and other chemical factors that adversely affect the gene human fund), risks, extraction of natural resources (renewable and non-renewable) and much more.
Regarding environmental risks in agriculture, it should be noted the risks of non-compliance with environmental standards; the emergence of epidemiological threats; risks of unfavorable natural and climatic conditions in the form of floods, fires, snow elements and avalanches, icing, and risks of soil erosion (landslides); use of plant protection products; use of GMOs, reduction of production productivity through the introduction of environmental processes.
The main ways to prevent environmental risks include many measures, management principles, and technologies to reduce and eliminate environmental risks, which are key tools to prevent environmental damage and "push" environmental risks below a safe level.
One of the ways to minimize environmental risks in agriculture is to optimize the structure of sown areas. Thus, according to the National Cadastre of Anthropogenic Emissions from Sources and Absorption by Greenhouse Gas Absorbers in Ukraine for 1990-2019, due to forest biomass growth, a significant level of accumulation of carbon emissions can be obtained. Similar results are observed in the cultivation of crops through the process of photosynthesis. Thus, about half of the CO2 absorbed by plants is spent on respiration and returned to the atmosphere. Moreover, the other parts are formed during the year the total production of biomass (terrestrial and underground) and dead organic matter, which with proper scientifically sound tillage will improve its quality. That is why it can be argued that knowing the indicators of carbon dioxide accumulation by the terrestrial part of crops, it is possible to increase the absorption of carbon dioxide by plants by forming appropriate crop structure, thus reducing the likelihood of ecological degradation and climatic nature.
Materials and Methods
In order to minimize environmental risks in the cultivation of crops, we have developed a model for optimizing the economic problem with two linear objective functions and a linear system of constraints. An economic-mathematical model is a mathematical description of a particular economic phenomenon or process. It can be used to predict the future behavior of an object when changing any parameters.
Anishin et al. (2014) and Ponomarenko et al. (2013) calculated the volumes of CO2 accumulation during the cultivation of cereals, which were taken as a basis for creating an optimization model.
At the same time, keep in mind that the goal of any business, including agriculture, is to maximize profits.
Construction and solution of the economic-mathematical model of optimization of the structure of grain crops involve four main stages:
The first stage is to build a qualitative model and identify the most critical factors and establish the laws to which they are subject.
Stage II - construction of the objective function and the system of constraints.
Stage III - the study of the influence of variables on the value of the objective function.
Stage IV - comparison of the results of calculations obtained in the third stage, with the object modeled in expert verification of the results (Dyacon, Kovalev, 2013).
The model contains a compromise solution on two indicators (gross output in comparative prices in 2010 (in order to reduce inflation) and the accumulation of carbon dioxide by cereals), both of which require finding the maximum:
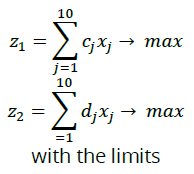
 (1)
(1)
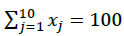
x1 + x2 + x3 ≤ b1 (2)
x4 + x5 + x6 ≤ b2 (3)
x8 ≤ b3 (4)
x10 ≤ b4 (5)
x2 ≥ b5 (6)
x3 ≥ b6 (7)
x5 ≥ b7 (8)
xj ≥ 0, j = 1,2,...,10 (9)
Variables xj, j=1,2,...,10 expressed as a percentage of the total sown area of the respective zone
x_1 - winter wheat,
x_2 - winter rye,
x_3 - winter barley,
x_4 - spring wheat,
x_5 - spring barley,
x_6 - oats,
x_7 - millet,
x_8 - buckwheat,
x_9 - peas, vetch,
x_10 - corn for grain.
Coefficients c_j≥0, j = 1,2, ..., 10 - production of gross output of the corresponding crop in comparative prices in 2010 per 1 ha of sown area, UAH
Coefficients d_j≥0, j = 1,2, ..., 10 - volumes of CO2 absorption by the respective crops per 1 ha, tons.
Restriction (1) is the norm added to 100%.
Restrictions (2), (3), (4), (5) correspond to the recommendations on crop rotation within the soil-climatic subzones of the Forest-Steppe zone and taking into account the existing crop structure.
Restrictions (6), (7), (8) ensure satisfaction with the security of countries and the education of existing structures of crop structures.
Restrictions (9) use the invariance of variables.
We accepted the limitations of the economic-mathematical model following the recommendations of Kaminsky et al. (2014).
Results
The natural and climatic conditions of Ukraine are favorable for growing different groups of crops, the optimal ratio of which is determined by research and recommended by typical crop rotations depending on the soil-climatic zone and specialization of production. However, these ratios of crop groups are not rigid and allow specific ranges given the profitability of crops and market conditions and the environmental consequences of growing certain plants for the soil and the environment in general. Today, the leaders in profitability are crops such as corn, wheat, sunflower, canola, and more. It should be considered that the cultivation of corn and sunflower significantly depletes the soil, which requires its restoration and therefore requires crop restriction. Also, when developing crop rotation systems, soil enrichment with nitrogen and other nutrients should be taken into account, which requires the presence of a group of legumes in the crop structure. When creating an optimization model of the structure of crops, it is necessary to consider these factors and set the necessary restrictions.
The economic-mathematical problem was carried out on the example of crops of the grain group of the Forest-Steppe zone, which is differentiated depending on the conditions of moisture into subzones of sufficient, unstable, and insufficient moisture. In the subzone of sufficient moisture, the annual rainfall averages 570-600 mm, the sum of temperatures above ten °C reaches 2300-2500 °C, SCC - 1.1-1.8. Specialists call winter wheat and corn for grain the main grain crops in crop rotation and recommend up to 30-40% of crops. However, the period of return of winter wheat to the previous place of cultivation without loss of yield is two years, and corn with the right system of fertilization and protection against weeds is allowed to grow again for two or more years (Kaminsky et al., 2014).
Winter rye and barley are less demanding than their predecessors, occupying relatively small areas (2-4%). The share of spring cereals in the recommended crop rotations is 15-20%.
The growing demand for cereals requires restrictions on their production of up to 3%.
As a result of solving the economic-mathematical problem, the structure of grain crops was optimized, which simultaneously satisfies two conditions - obtaining the maximum volume of gross output and the maximum amount of accumulated CO2 (Table 1).
| Coefficients and constraints of the model | Optimal value | ||||||
|---|---|---|---|---|---|---|---|
| c1 | 4911.5 | d1 | 27.28 | b1 | 39.3 | x1 | 36.4 |
| c2 | 2845.1 | d2 | 19.63 | b2 | 25 | x2 | 2 |
| c3 | 3959.1 | d3 | 20.32 | b3 | 2.5 | x3 | 0.9 |
| c4 | 3770.9 | d4 | 19.35 | b4 | 34 | x4 | 20.851 |
| c5 | 3587.0 | d5 | 19.62 | b5 | 2 | x5 | 4.149 |
| c6 | 2316.3 | d6 | 15.30 | b6 | 0.9 | x6 | 0 |
| c7 | 2009.6 | d7 | 13.12 | b7 | 1.4 | x7 | 0 |
| c8 | 5150.7 | d8 | 11.57 | x8 | 1.7 | ||
| c9 | 2485.8 | d9 | 19.80 | x9 | 0 | ||
| c10 | 9879.6 | d10 | 48.84 | x10 | 34 | ||
Table 1. Coefficients and optimal structure of cereal crops in the subzone of sufficient moisture of the forest-steppe
The analysis of statistical data of the agrarian sphere of the subzone of sufficient moisture of the Forest-Steppe zone for the period 2010-2020 revealed that the share of grain crops in the total sown area of the region is 70% and averages 12,817 thousand hectares, which we will take into account in calculations for the optimization structure of grain areas. It is essential to consider the specialization of production.
Thus, given the actual levels of specialization of agriculture in this area in the last period, we consider it necessary to make calculations within the two main specializations:
1) grain production (grain production with developed pig breeding) - the area of grain crops is 95-100%;
2) grain production with developed meat and dairy cattle breeding - the area of grain crops is 50-60%.
The data in Table 2 shows that the optimization of the structure of grain crops with specialization of grain production and grain production with developed pig farming without additional investment will increase gross grain production by 240,257 thousand UAH and get a significant environmental effect - an increase in carbon dioxide accumulation of 7,034 thousand tons.
| Crops | Crop structure,% | Crop area, thousand ha |
Production of gross output at comparable prices in 2010, thousand UAH |
Accumulation of CO2, tons | ||||
|---|---|---|---|---|---|---|---|---|
| actually | optimized | actually | optimized | actually | optimized | actually | optimized | |
| Winter wheat | 34.3 | 36.4 | 439.6 | 466.5 | 2159209 | 2291405 | 11992918 | 11992918 |
| Winter rye | 4.1 | 2 | 52.5 | 25.6 | 149509 | 72931 | 1031551 | 503195 |
| Winter barley | 1.9 | 0.9 | 24.4 | 11.5 | 96413 | 45669 | 494839 | 234397 |
| Spring wheat | 3.0 | 20.9 | 38.5 | 267.9 | 144995 | 1010131 | 744027 | 5183387 |
| Spring barley | 11.8 | 4.2 | 151.2 | 53.8 | 542500 | 193093 | 2967341 | 1056172 |
| Oat | 4.6 | 0 | 59.0 | 0.0 | 136565 | 0 | 902060 | 0 |
| Millet | 0.4 | 0 | 5.1 | 0.0 | 10303 | 0 | 67264 | 0 |
| Buckwheat | 2.8 | 1.7 | 35.9 | 21.8 | 184846 | 112228 | 415220 | 252098 |
| Peas, shouts | 3.5 | 0 | 35.9 | 0.0 | 111512 | 0 | 888218 | 0 |
| Corn | 33.6 | 34 | 430.7 | 435.8 | 4254662 | 4305312 | 21033005 | 21283398 |
| Total | 100.0 | 100.0 | 1281.7 | 1281.7 | 7790513 | 8030771 | 40536441 | 41239825 |
| Deviation of the optimized level from the actual one | - | - | - | - | 240257 | 703384 | ||
Table 2. Evaluation of the results of optimizing the structure of cereal crops in the subzone of sufficient moisture of the forest-steppe (specialization grain production, grain production with developed pig breeding)
If the farm has a grain and livestock production direction, then the optimization of the structure will increase the volume of gross output in the amount of 144,155 thousand UAH and 422.0 thousand tons of accumulated carbon dioxide (Table 3).
| Crops | Crop structure,% | Crop area, thousand ha |
Production of gross output at comparable prices in 2010, thousand UAH |
Accumulation of CO2, tons | ||||
|---|---|---|---|---|---|---|---|---|
| actually | optimized | actually | optimized | actually | optimized | actually | optimized | |
| Winter wheat | 34.3 | 36.4 | 263.8 | 279.9 | 1295525 | 1374843 | 7195751 | 7636307 |
| Winter rye | 4.1 | 2 | 31.5 | 15.4 | 89705 | 43759 | 618931 | 301917 |
| Winter barley | 1.9 | 0.9 | 14.6 | 6.9 | 57848 | 27401 | 296903 | 140638 |
| Spring wheat | 3.0 | 20.9 | 23.1 | 160.7 | 86997 | 606079 | 446416 | 3110032 |
| Spring barley | 11.8 | 4.2 | 90.7 | 32.3 | 325500 | 115856 | 1780405 | 633703 |
| Oat | 4.6 | 0 | 35.4 | 0.0 | 81939 | 0 | 541236 | 0 |
| Millet | 0.4 | 0 | 3.1 | 0.0 | 6182 | 0 | 40358 | 0 |
| Buckwheat | 2.8 | 1.7 | 21.5 | 13.1 | 110908 | 67337 | 249132 | 151259 |
| Peas, shouts | 3.5 | 0 | 26.9 | 0.0 | 66907 | 0 | 888218 | 0 |
| Corn | 33.6 | 34 | 258.4 | 261.5 | 2552797 | 2583187 | 12619803 | 12770039 |
| Total | 100.0 | 100.0 | 769.0 | 769.0 | 4674308 | 2583187 | 24321865 | 24743895 |
| Deviation of the optimized level from the actual one | - | - | - | - | 144155 | 422030 | ||
Table 3. Evaluation of the results of optimization of the structure of cereal crops in the subzone of sufficient moisture of the forest-steppe (specialization grain production with developed meat and dairy farming)
The zone of unstable moisture is characterized by significant diversity in soil quality, temperature, and water regimes. On average, 480-500 mm of precipitation falls per year. This subzone includes Vinnytsia, Cherkasy, northern districts of Odessa, Poltava, and Kirovohrad regions, forest-steppe districts of Kyiv, Chernihiv, Sumy, and Kharkiv regions (Kaminsky et al., 2014).
Regarding the recommended crop rotation, the experts propose to allocate a group of cereals depending on the production direction:
1) grain production (grain production with developed pig breeding) - the area of grain crops is 75-100%;
2) grain production with developed meat and dairy livestock - the area under cereals is 55-60%.
We calculated the optimized structure of sown areas under cereals, which maximizes the volume of gross output and accumulation of carbon dioxide in the subzone of unstable moisture of the Forest-Steppe (Table 4).
| Coefficients and constraints of the model | Optimal value | ||||||
|---|---|---|---|---|---|---|---|
| c1 | 4962.8 | d1 | 27.56 | b1 | 37.5 | x1 | 34.8 |
| c2 | 2681.0 | d2 | 18.49 | b2 | 16 | x2 | 0.3 |
| c3 | 4016.3 | d3 | 20.61 | b3 | 2 | x3 | 2.4 |
| c4 | 4079.2 | d4 | 20.93 | b4 | 49.5 | x4 | 11.903 |
| c5 | 3463.0 | d5 | 18.94 | b5 | 0.3 | x5 | 0.4 |
| c6 | 2227.9 | d6 | 14.71 | b6 | 0.4 | x6 | 0 |
| c7 | 2170.4 | d7 | 14.71 | b7 | 1.4 | x7 | 0 |
| c8 | 5079.2 | d8 | 11.41 | x8 | 0.697 | ||
| c9 | 2273.3 | d9 | 8.97 | x9 | 0 | ||
| c10 | 10072.7 | d10 | 49.79 | x10 | 49.5 | ||
Table 4. Coefficients and optimal structure of grain crops in the subzone of unstable moisture of the Forest-Steppe
Analysis of statistical data of the agricultural sector of the sub-zone of sufficient moisture of the Forest-Steppe zone for the period 2010-2020 revealed that the share of grain crops in the total sown area of the region is 68.9% and averages 2106.3 thousand hectares, which we will take into account in the process of calculating the results of the optimization structure of grain areas (Table 5).
| Crops | Crop structure,% | Crop area, thousand ha |
Production of gross output at comparable prices in 2010, thousand UAH |
Accumulation of CO2, tons | ||||
|---|---|---|---|---|---|---|---|---|
| actually | optimized | actually | optimized | actually | optimized | actually | optimized | |
| Winter wheat | 32.6 | 34.8 | 687 | 733 | 3408451 | 3637695 | 18928208 | 20201271 |
| Winter rye | 0.6 | 0.3 | 13 | 6 | 34853 | 16941 | 240370 | 116836 |
| Winter barley | 2.4 |
2.4 | 50 | 51 | 200413 | 203029 | 1028439 | 1041860 |
| Spring wheat | 1.5 | 11.9 | 31 | 251 | 126863 | 1022450 | 650923 | 5246098 |
| Spring barley | 8.7 | 0.4 | 184 | 8 | 637885 | 29176 | 3488748 | 159573 |
| Oat | 0.4 | 0.0 | 8 | 0 | 17823 | 0 | 117680 | 0 |
| Millet | 0.1 | 0.0 | 3 | 0 | 5426 | 0 | 35425 | 0 |
| Buckwheat | 0.8 | 0.7 | 16 | 15 | 81267 | 74888 | 182560 | 168230 |
| Peas, shouts | 3.8 | 0.0 | 31 | 0 | 183910 | 0 | 1464290 | 0 |
| Corn | 49.1 | 49.5 | 1034 | 1043 | 10414165 | 10501983 | 51477881 | 51911975 |
| Total | 100.0 | 100.0 | 2106 | 2106 | 15111056 | 15486163 | 77614524 | 78845844 |
| Deviation of the optimized level from the actual one | - | - | - | - | 375107 | 1231320 | ||
Table 5. Estimation of results of optimization of the structure of crops of grain crops in a subzone of unstable humidification of the Forest-steppe (specialization grain production, grain production with developed pig breeding)
Optimizing grain crops in the grain production direction in the subzone of unstable moisture of the Forest-Steppe will increase the cost of gross output by 375,107 thousand UAH and increase the accumulation of carbon dioxin in the amount of 1,231,320 tons.
If the production direction is the grain with developed dairy and meat livestock, then due to the decrease in the share of cereals in the structure of crops, the optimization results will be lower than the previous specialization but significant compared to production non-optimized structure (Table 6).
| Crops | Crop structure,% | Crop area, thousand ha |
Production of gross output at comparable prices in 2010, thousand UAH |
Accumulation of CO2, tons | ||||
|---|---|---|---|---|---|---|---|---|
| actually | optimized | actually | optimized | actually | optimized | actually | optimized | |
| Winter wheat | 32.6 | 34.8 | 378 | 403 | 1874648 | 2000732 | 10410514 | 11110699 |
| Winter rye | 0.6 | 0.3 | 7 | 3 | 19169 | 9318 | 132204 | 64260 |
| Winter barley | 2.4 |
2.4 | 28 | 28 | 110227 | 111666 | 565641 | 573023 |
| Spring wheat | 1.5 | 11.9 | 17 | 138 | 69775 | 562348 | 358008 | 2885354 |
| Spring barley | 8.7 | 0.4 | 101 | 4 | 350837 | 16047 | 1918811 | 87765 |
| Oat | 0.4 | 0.0 | 4 | 0 | 9803 | 0 | 64724 | 0 |
| Millet | 0.1 | 0.0 | 2 | 0 | 2984 | 0 | 19484 | 0 |
| Buckwheat | 0.8 | 0.7 | 9 | 8 | 44697 | 41188 | 100408 | 92527 |
| Peas, shouts | 3.8 | 0.0 | 45 | 0 | 101151 | 0 | 805360 | 0 |
| Corn | 49.1 | 49.5 | 569 | 574 | 5727791 | 5776091 | 28312835 | 28551586 |
| Total | 100.0 | 100.0 | 1158 | 1158 | 8311081 | 8517390 | 42687988 | 43365214 |
| Deviation of the optimized level from the actual one | - | - | - | - | 206309 | 677226 | ||
Table 6. Estimation of results of optimization of the structure of crops of grain crops in a subzone of unstable humidification of the Forest-steppe (specialization grain production with developed meat and dairy farming)
The forest-steppe districts of Odesa, Kirovohrad, and Poltava regions belong to the Forest-Steppe zone of insufficient moisture. The average annual rainfall is 430-450 mm, and the sum of temperatures above 10oC reaches 2600-2900 oC, SCC - 0.9-1.2 (Kaminsky et al., 2014). At specialization of production of grain production (production of grain with the developed pig breeding), it is recommended to concentrate the area of crops of grain crops at the level of 80-100%, and at the specialization of production of grain with the developed meat and dairy cattle breeding - 75-80%. The results of solving the economic problem of optimizing the area of the grain group are given in table 7.
| Coefficients and constraints of the model | Optimal value | ||||||
|---|---|---|---|---|---|---|---|
| c1 | 4706.0 | d1 | 26.14 | b1 | 45 | x1 | 38.8 |
| c2 | 2598.9 | d2 | 17.93 | b2 | 25 | x2 | 6 |
| c3 | 3796.9 | d3 | 19.48 | b3 | 1 | x3 | 0.2 |
| c4 | 3740.1 | d4 | 19.19 | b4 | 38 | x4 | 15.7 |
| c5 | 3195.9 | d5 | 17.48 | b5 | 0.2 | x5 | 0.3 |
| c6 | 2060.0 | d6 | 13.60 | b6 | 6 | x6 | 0 |
| c7 | 2049.8 | d7 | 13.38 | b7 | 0.3 | x7 | 0 |
| c8 | 4650.0 | d8 | 10.45 | x8 | 1 | ||
| c9 | 1869.6 | d9 | 7.37 | x9 | 0 | ||
| c10 | 9203.8 | d10 | 45.50 | x10 | 38 | ||
Table 7. Coefficients and optimal structure of grain crops in the subzone of insufficient moisture of the Forest-Steppe
The analysis of statistical data of the agrarian sphere of the subzone of sufficient moisture of the Forest-Steppe zone for the period 2010-2020 revealed that the share of grain crops in the total sown area of the region is at 77.7% and averages 2989 thousand hectares, which we have to consider in calculations for the optimization structure of grain areas (Table 8).
| Crops | Crop structure,% | Crop area, thousand ha |
Production of gross output at comparable prices in 2010, thousand UAH |
Accumulation of CO2, tons | ||||
|---|---|---|---|---|---|---|---|---|
| actually | optimized | actually | optimized | actually | optimized | actually | optimized | |
| Winter wheat | 38.6 | 38.8 | 1153 | 1160 | 5424117 | 5457673 | 30128859 | 30315252 |
| Winter rye | 0.5 | 6.0 | 15 | 179 | 38802 | 466085 | 267695 | 3215551 |
| Winter barley | 11.7 |
0.2 | 349 | 6 | 1326493 | 22698 | 6805572 | 116451 |
| Spring wheat | 0.5 | 15.7 | 15 | 469 | 55840 | 1755120 | 286507 | 9005307 |
| Spring barley | 6.9 | 0.3 | 206 | 9 | 658464 | 28658 | 3601474 | 156742 |
| Oat | 0.2 | 0.0 | 6 | 0 | 12302 | 0 | 81219 | 0 |
| Millet | 0.3 | 0.0 | 9 | 0 | 18362 | 0 | 119858 | 0 |
| Buckwheat | 0.4 | 1.0 | 12 | 30 | 55540 | 138988 | 124815 | 312349 |
| Peas, shouts | 3.6 | 0.0 | 107 | 0 | 200975 | 0 | 792246 | 0 |
| Corn | 37.4 | 38.0 | 1117 | 1136 | 10278473 | 10453811 | 50812762 | 51679568 |
| Total | 100.0 | 100.0 | 2989 | 2989 | 18069366 | 18323032 | 93021007 | 94801221 |
| Deviation of the optimized level from the actual one | - | - | - | - | 1780214 | 1780214 | ||
Table 8. Evaluation of the results of optimization of the structure of cereal crops in the subzone of insufficient moisture of the Forest-Steppe (specialization grain production, grain production with developed pig breeding)
The result of optimizing the structure of grain crops in the subzone of insufficient moisture in the Forest-Steppe zone in the grain production direction will increase gross grain production in comparative prices in 2016 for 253,666 thousand UAH accumulation of carbon dioxide in the amount of 1,780,214 tons.
Implementation of modeling results in grain production with developed livestock (Table 9) will increase the cost of gross grain production by 253,666 thousand UAH to 18,323,032 thousand UAH and at the same time the amount of CO2 accumulation by 1,780,214 tons (up to 94801221 tons).
| Crops | Crop structure,% | Crop area, thousand ha |
Production of gross output at comparable prices in 2010, thousand UAH |
Accumulation of CO2, tons | ||||
|---|---|---|---|---|---|---|---|---|
| actually | optimized | actually | optimized | actually | optimized | actually | optimized | |
| Winter wheat | 38.6 | 38.8 | 577 | 580 | 2712059 | 2728837 | 15064430 | 15157626 |
| Winter rye | 0.5 | 6.0 | 8 | 90 | 19401 | 233043 | 133848 | 1607776 |
| Winter barley | 11.7 |
0.2 | 175 | 3 | 663247 | 11349 | 3402786 | 58226 |
| Spring wheat | 0.5 | 15.7 | 8 | 235 | 27920 | 877560 | 143254 | 4502654 |
| Spring barley | 6.9 | 0.3 | 103 | 5 | 329232 | 14329 | 1800737 | 78371 |
| Oat | 0.2 | 0.0 | 3 | 0 | 6151 | 0 | 40610 | 0 |
| Millet | 0.3 | 0.0 | 5 | 0 | 9181 | 0 | 59929 | 0 |
| Buckwheat | 0.4 | 1.0 | 6 | 15 | 27770 | 69494 | 62408 | 156175 |
| Peas, shouts | 3.6 | 0.0 | 54 | 0 | 100488 | 0 | 396123 | 0 |
| Corn | 37.4 | 38.0 | 559 | 568 | 5139237 | 5226906 | 25406381 | 25839784 |
| Total | 100.0 | 100.0 | 1495 | 1495 | 9034683 | 9161516 | 46510504 | 47400611 |
| Deviation of the optimized level from the actual one | - | - | - | - | 1780214 | 1780214 | ||
Table 9. Evaluation of the results of optimization of the structure of cereal crops in the subzone of insufficient moisture of the Forest-Steppe (specialization grain production with developed meat and dairy farming)
The calculations allow generalizing the optimization of the structure of grain crops in the Forest-Steppe zone in terms of subzones by moisture factor (Table 10).
| Specialization | Subzone of sufficient moisture | Subzone of unstable moisture | Subzone of insufficient moisture | Forest-steppe zone | ||||
|---|---|---|---|---|---|---|---|---|
| increase in gross output, thousand UAH | increase in CO2 accumulation, tons | increase in gross output, thousand UAH | increase in CO2 accumulation, tons | increase in gross output, thousand UAH | increase in CO2 accumulation, tons | increase in gross output, thousand UAH | increase in CO2 accumulation, tons | |
| Grain production | 240257 | 703384 | 375107 | 1231320 | 253666 | 1780214 | 869030 | 3714918 |
| Grain production with developed meat and dairy cattle breeding | 144155 | 422030 | 206309 | 677226 | 126833 | 890107 | 477297 | 1989363 |
Table 10. The results of optimizing the structure of sown areas of cereals in the Forest-Steppe zone in order to maximize the cost of gross grain production and carbon dioxide accumulation
Conclusion
Thus, we can conclude that as a result of economic and mathematical modeling (the goal is to maximize gross output and carbon dioxide accumulation), an optimized structure of grain crops in terms of Forest-Steppe subzones was obtained. Implementation of the optimization problem results will allow increasing the economic and environmental effects of grain production without unnecessary investments. So, the increase in the value of gross output in the region with specialization of grain production is 869,030 thousand UAH, and at the same time increase CO2 accumulation in the amount of 3,714,918 tons, and taking into account the livestock industry to optimize the structure of grain crops can get an additional 477,297 thousand UAH VP and 1,989,363 tons of CO2.
References
Anishin, L.A., Gritsayenko, Z.M., Ponomarenko, S.P., Grigoryuk, I.P., Serga, O.I. (2014). Utilization of carbon dioxide under the conditions of growing cereals using biostimulators of growth. Scientific Bulletin of the National University of Life and Environmental Sciences of Ukraine. Series: Biology, Biotechnology, Ecology, 204, 56-65.
Burliai, A., Burliai, O., Revutska, А., Smolii, L., & Klymenko, L. (2021). Organizational and economic risks of agricultural ecologization. Agricultural and Resource Economics: International Scientific E-Journal, 96-114.
Dyacon, V.M., Kovalev, D.E. (2013). Models and methods of decision making: a textbook. Kiyv ANF GROUP.
Hęćka, A., & Łyskawa, K. (2016). Ubezpieczenia zagrożeń środowiskowych w gospodarstwie rolnym. Prace Naukowe Uniwersytetu Ekonomicznego we Wrocławiu, (415 Ubezpieczenia wobec wyzwań XXI wieku), 55-67.
Kaminsky, V.F., Saiko, V.F., Shevchenko, I.P. (2012). Modern systems of agriculture and technologies of cultivation of crops. Kyiv: VP "Edelweiss".
Komarek, A. M., De Pinto, A., & Smith, V. H. (2020). A review of types of risks in agriculture: What we know and what we need to know. Agricultural Systems, 178, 102738.
Meuwissen, M. P. M., Hardaker, J. B., Huirne, R. B. M., & Dijkhuizen, A. A. (2001). Sharing risks in agriculture; principles and empirical results. NJAS-Wageningen Journal of Life Sciences, 49(4), 343-356.
National inventory of anthropogenic emissions by sources and removals by sinks of greenhouse gases in Ukraine for 1990- 2019. Official portal of the Ministry of Energy and Environmental Protection. Available from: https://menr.gov.ua/content/nacionalniy-kadastr-antropogennih-vikidiv-iz-dzherel-ta-absorbcii-poglinachami- parnikovih-gaziv.html.
Ponomarenko, S.P., Datsko, L.V. (2014). Accumulation of CO2 by cereals using bioregulators of plant growth. Available from: vnau_biol_2014_204_10%20(2).pdf.
Ponomarenko, S.P., Gritsayenko, Z.M., Anishin, L.A., Datsko, L.V. (2013). Increasing the level of CO2 utilization should become a reality in Ukraine. Phytohormones, humic substances and other biologically active compounds for agriculture, human health and environmental protection: materials of reports of the IX International Conference daRostim. 7–10.10.2013. Lviv: Lviv Polytechnic Publishing House.
Statistical collection "Environment of Ukraine for 2019". (2020). State Statistics Service of Ukraine. O. Prokopenko. Kyiv.
Author Info
А.P. Burliai*, O.L. Burliai, Yu.О. Nesterchuk, I.I. Cherneha, S.Yu. Sokoliuk and A.A. OsipovaCitation: Burliai, A.P., Burliai, O.L., Nesterchuk, Yu.О., Cherneha, I.I., Sokoliuk, S.Yu., Osipova, A.A. (2021). Minimization of environmental risks in crops cultivation. Ukrainian Journal of Ecology, 11 (3), 296-304.
Received: 02-May-2021 Accepted: 15-Jun-2021 Published: 31-May-2021, DOI: 10.15421/2021_175
Copyright: This is an open access article distributed under the terms of the Creative Commons Attribution License, which permits unrestricted use, distribution, and reproduction in any medium, provided the original work is properly cited.