Research - (2022) Volume 12, Issue 1
Effect of successive adaptations on the metabolization of phenol by a consortium isolated from polluted soils of an oil field in Algeria
A. Rezzoug1*, F. Benaceur1,2, H. Gouzi1, I. Messahli1, L. Rouari1, L. Hamida1, M. Labiodh1, M. Halifa1 and R. Chaibi1Abstract
Biological degradation of organic pollutants such as phenol is a subject of interest which affects environment; phenol is considered a danger for living organisms when it is present in the state delivered at very high concentrations. Our approach was mainly elucidated to target the degradation of high degrees of phenol by successive adaptations to low concentrations by a consortium constituted of Bacillus sp., Pseudomonas sp. and Micrococcus sp. isolated from an oil field present in the region of Hassi Messaoud, Algeria. Biodegradation has been conducted out in batch mineral culture utilizing phenol as the only source of carbon and energy aerobically after adjusting the physical-chemical conditions of degradation, the consortium exhibited a significant tolerance to a variety of conditions of pH between 5 and 9 as well as a temperature tolerance between 22°C and 37°C, However, the optimum of degradation is maintained at 30°C and a pH of 7. The mixed culture showed that low phenol concentrations from 300 mg/L to 700 mg/L did not necessitate any pre-adaptation to be degraded, as well as a significant tolerance for 1000 mg/L, but the high levels of phenol required at least one pre-adaptation at low concentrations. The consortium was able to degrade 96.43 ± 4.50 (%) from 1300 mg/L of phenol in 24 H by pre-adapting sequentially to 500 mg/L, 1000 mg/L and 1200 mg/L. It should be highlighted that the direct passage through 1000 mg/L did not yield meaningful effects.
Keywords
Pre-adaptation, Phenol, Biodegradation, Mixed culture, Routes.
Introduction
Today, one of the major environmental problems faced by the world is depollution of natural areas (Anupama et al., 2013) industrial processes create a variety of molecules that can pollute soil, air and waters due to negative impacts such as toxicity, carcinogenic and mutagenic properties leads to progressive declining in our quality of life (Busca et al., 2008) phenol has been classified as a high important priority pollutant by the united state environmental protection agency (EPA) ( Subramaniam et al., 2020), it is an aromatic chemical hydrocarbon with a hydroxyl group (OH) coupled to the benzene ring, and it is the simplest of the phenols. It's also a core structural unit for a wide range of synthetic chemical compounds (Li et al., 2019); it is a toxic substance at high concentrations and may be assimilated through the lungs by inhalation, skin, and the digestive tract (Zhao et al., 2010).
Phenol is harmful not only to humans but also to other organisms, terrestrial and aquatic animals and plants (Wang et al., 2011) phenol is present in the environment at high levels which exceed standards, the maximum allowed concentration of phenols in water is 0.1 mg/L (Ucun et al., 2010) but studies show that free phenols are habitually liberated from industrial processes and present in wastewaters equal as refineries (6-500 mg/L), coking process (28-3900 mg/L) manufacture of petrochemicals (2.8-1220 mg/L) and coal transformation (9-6800 mg/L). Other origin of waste stream water containing phenols is plastics, resins, pharmaceutical, wood products, tincture, and paper industries (0.1-1600 mg/L) (Kumaran and Paruchuri, 1997; González-Muñoz et al., 2003).
In general, two types of decontamination approach are available for phenol, one is based on regeneration and the other on destruction which contains the biological treatment by microorganisms, but when the phenol content exceeds 1000 mg/L in wastewater, the recovery scheme becomes preferable because the microorganisms cannot tolerate concentrations that exceed 3000 mg/L of phenol because it becomes toxic to living cells (Ucun et al; 2010; Shahryari et al., 2018).
Nevertheless, few studies focus on the microbial biodegradation of high concentrations of phenol and their use in bioremediation, Pseudomonas putida, Candida tropicalis, Rhodococcus, Trichosporon dulcitum, Acinetobacter and Alcaligenes faecalis showed high capacity and efficiency to biodegrade a high concentration of phenol (Margesin et al., 2004; Yan Jiang et al., 2007; Shahryari et al., 2018; Abarian et al., 2019; Basak et al., 2019), however various methods have been suggested to overcome substrate inhibition in order to deal high concentration of phenol (Kyung Han Kwon et al., 2009) they comprise adapting the cells to higher concentration of substrate (Yang et al., 1975; Kwon et al., 2009); employing immobilized microorganisms carried out in packed bed reactors (PBRs) (Basak et al., 2019); adaptation of mixed culture (Marrot et al., 2005); and addition of other types of carbon sources such as glucose or yeast extract (Loh et al., 2000); a pre-adaptation to low concentrations of phenol increases the microbial capacity to degrade high concentrations of the latter (Kwon et al., 2009) but also a pre-adaptation to other pollutants such as toluene and benzene leads to better degradation of high concentration of phenol much more than the pre-adaptation to phenol (Yeom et al., 1997).
Additionally mixed culture has a richer biodegradation capacity, both qualitatively and quantitatively, which may be explained primarily in biochemical terms such as commensal and synergistic interactions, substrate relief inhibition, and co-metabolism. As a result, mixed culture has a larger metabolic capacity than pure culture, leading it to degrade at a greater rate; several studies support this claim (Subramaniam et al., 2020). The main objective of this study is to target the degradation of high concentrations of phenol by a mixed bacterial culture by adapting successive adaptations to relatively low concentrations.
Materials and Methods
Microorganisms
Bacterial strains were isolated from polluted soils in an oil field at Hassi Messaoud, Algeria. Different samples were collected under microbiological sampling conditions, while the microorganisms were isolated in Luria Bertani Agar medium using a decimal dilution and depletion technique. Genera of microorganisms of interest were identified by means of morphological and chemical characteristics and their ability to develop in a selective medium. The parameters tested included colonial morphology, microscopic shape, Gram’s reaction, respiratory enzyme, natural resistance to antibiotics and some biochemical test using API 20E, API 50 CH and API STAPH from biomerieux (France). The results of preliminary identification were compared with Bergey’s Manual of Determinative Bacteria (Buchanan et al., 1974). The purity of isolates was verified by microscopic observation, catalase reaction and pure isolates were conserved at 4°C in LB medium for a short duration.
Mineral medium and colorimetric assays
In the present study, only bacteria which have the ability to degrade phenol as a sole source of carbon and energy were selected in mineral medium with the following composition: 1000 mg NaCl; 200 mg MgSO4; 1700 mg KH2PO4; 100 mg NH4Cl; 4350 mg HK2PO4; 30 mg CaCl4 and 1000 ml distilled water. The pH of MM was adjusted to pH 7 by a solution of 1N NaOH and 1N HCl and distributed in 250ml flasks, then autoclaved at 120°C/1B for 20 min. for the bacterial culture medium conditions, all cultures were performed in mineral medium in batch and incubated aerobically at 30°C under shaking at 250 rpm. Residual phenol concentration was estimated from supernatant after centrifugation of 5 ml of a mineral culture, the revelation of residual phenol was established with Folin-ciocalteu method and a sodium carbonate solution (20%), the absorbance was measured at 765 nm (OD 765) in UV-spectrophotometer OPTIMA (SP-3000 nano) and the results were confirmed with a control flask under the same conditions.
Effect of temperature and pH
Physical and chemical parameters have an importance in the development of any degradation process; the consortium was cultured under different parameters of pH values varied from 5 to 9, and temperature from 20°C to 47°C. The initial phenol concentration for physical-chemical conditions was fixed at 100 mg/L of each parameter, and the mixed culture biomass was putted aseptically from a suspension prepared with MM, all flasks were incubated with mechanic rotator at 250 rpm. Supernatants were periodically taken from flask for determining phenol concentration.
Effect of successive adaptation routes
Suspension of a mixed bacterial was prepared with the mineral medium, the density of this suspension was adjusted to 1.08 optical density measured at a wavelength of 620 nm (OD620) (UV-VIS spectrophotometer). Then, in flasks, which contain 45 ml of mineral medium, 3 ml of inoculums was completed to each vial to have an equal microbial density in all vials. Initial phenol concentration changing in rang 300-1300 mg/L. The microbial biomass produced from the degradation of low concentration has been subsequently recovered by centrifugation at 4000 rpm for 15 minutes and washed with sterile distilled water twice; the microbial butt formed corresponds to our adapted biomass with which we created a second culture using the same processes by raising the beginning phenol concentrations (Fig. 1). Colorimetric phenol tests are performed every two hours until the phenol is completely degraded in order to determine the time required for full degradation. The cultures were performed several times to ensure that the findings were correct. The optical densities were converted into concentration and then into a percentage for analyzing the results.
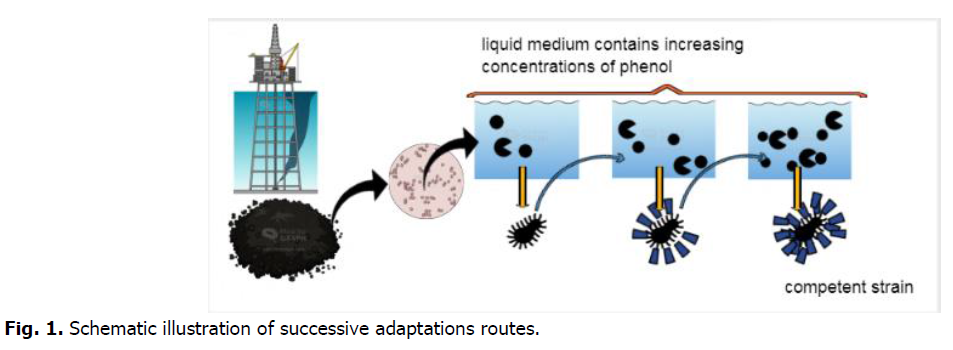
Fig 1. Schematic illustration of successive adaptations routes.
Statistical data
Each experiment was repeated three times and data presented as mean ± SD. to determine the effect of adaption pathways on the rate of phenol degradation, a one-way ANOVA was applied following by the Tukey’s multiple comparison between groups using IBM SPSS Statistics version 21 (Spss Inc. Chicago, Illinois, USA, 2012) and Graph Pad prism (www.graphpad.com).
Results
Preliminary identification of microorganisms
Once it was observed that amongst 11 different bacteria, the S4, S8 and S11 were identified and used in the consortium combination. Each isolates have a distinct colonial morphology that allowed them to be classified as different bacterial strains. S4 was assigned to the genus Bacillus owing their well-defined macroscopic aspect and according to their microscopic form of gram-positive sporulated large bacilli, catalase positive, oxidase negative, oxidizes glucose maltose and sucrose, VP positive, urease negative, no motile, strictly aerobic…etc. All biochemical assays revealed that the S8 strain matched to the Pseudomonas genus, a cellular form of coccobacillus, gram negative. catalase, oxidase, glucose, sucrose, mannitol, arabinose, melrose, citrate permease, rhamnose, urease, arginine dihydrolase, and tryptophan is one of the positive tests noted. By King A and King B media, this bacterium produced pyocyanin and pyoverdin pigments, which were used to identify it. These pigments diffuse in agar cultures and colonies colour the medium greenish yellow. Strain S11 is attached to the genus Micrococcus, their colonies have an orange-yellow color, the cells are gram-positive cocci that are grouped on irregular clusters, and they are catalase and oxidase positive; they form acid from glucose, arabinose, lactose, maltose, mannitol and xylos etc. All of the Api gallery's tests were used to determine the strain's identity.
Effect of pH and temperature
Phenol is considered as a toxic substrate at high level but also a source of nutrient which serves to provide the elements necessary for the growth and development of microorganisms. In the current study, the mixed culture of Pseudomonas sp., Bacillus sp. and Micrococcus sp. showed great efficiency in degrading phenol as the only source of carbon and energy under standardized physical-chemical conditions. Table 1 and Fig. 2 and 3, represent the variations of phenol rate consumed by the consortium during the time at different temperatures and different pH, although; the best degradation achievement occurred at pH 7 and no marked difference was observed within the 5-9 rang. The effect of temperature on the degradation was also analyzed. The decrease phase of phenol was extended at 30°C and 37°C, however, the mixed culture was able to develop within high and low temperature, and the phenol degradation rate descends at temperature higher than 37°C. The result of the one-way ANOVA test shows that there is no significant effect of change in pH on the consumption of phenol rate by the consortium (P-value=0.56). Tukey test classified the entire datum to one class (a) as showing in Fig. 1. While the change in temperature (Table 1), the one-way ANOVA analysis confirms that the Phenol rate consumed by consortium during the time is also not significant (P-value=0.27). Otherwise, the post-hoc test (Tukey test) regroups the variables into only one group too (Table 1).
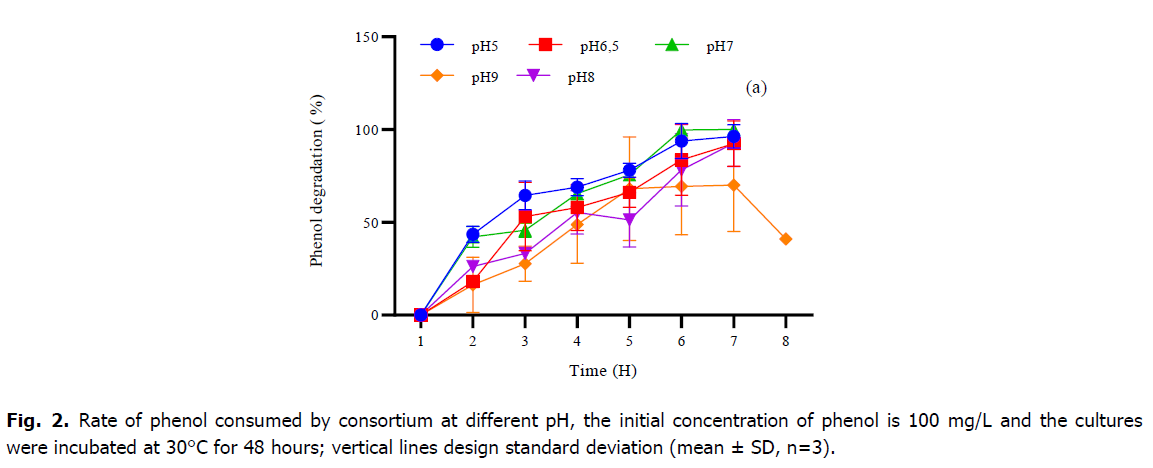
Fig 2. Rate of phenol consumed by consortium at different pH, the initial concentration of phenol is 100 mg/L and the cultures were incubated at 30°C for 48 hours; vertical lines design standard deviation (mean ± SD, n=3).
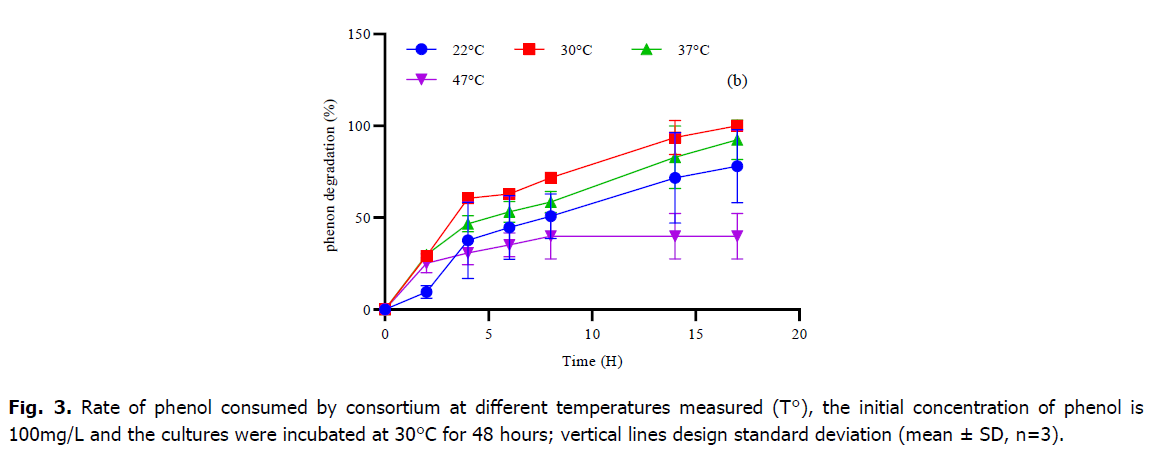
Fig 3. Rate of phenol consumed by consortium at different temperatures measured (T°), the initial concentration of phenol is 100mg/L and the cultures were incubated at 30°C for 48 hours; vertical lines design standard deviation (mean ± SD, n=3).
| Variables | Modalities | Mean ± SD | p-value |
|---|---|---|---|
| pH | pH=5 | 63.61 ± 33.34 (a) | 0.56 |
| pH=6.5 | 46.55 ± 31.37 (a) | ||
| pH=7 | 65.16 ± 34.66 (a) | ||
| pH=8 | 46.26 ± 29.81 (a) | ||
| pH=9 | 44.86 ± 27.87 (a) | ||
| T° | T=22° | 42.82 ± 30.75 (a) | 0.27 |
| T=30° | 59.74 ± 35.20 (a) | ||
| T=37° | 54.02 ± 32.52 (a) | ||
| T=47° | 30.14 ± 14.41 (a) |
Table 1. Variation of phenol rate metabolized by the consortium during time at different temperatures and different pH expressed in percentage.
Biodegradation of phenol with no-adapted cells (concentration effect)
In the present study, no-adapted bacterial mixed culture totally digested phenol concentrations of 300 mg/L, 500 mg/L, 700 mg/L, and 1000 mg/L, resulting in a wide range of times for complete phenol degradation, with a long time for higher concentrations (Fig. 4). However; the consortium began to degrade 1000 mg/L after 7 hours of adaptation, the degradation of 300 mg/L, 500 mg/L and 700 mg/L did not require any adaptation period. For the times of the complete degradation period (adaptation and actual degradation period) 1000 mg/L was completely degraded in 54 hours, 700 mg/L was finished within a time of 29 hours, 300 mg/L and 500 mg/L was being exhausted in a time of 21 hours, respectively. Furthermore, no degradation was seen at amounts greater than 1000 mg/L.
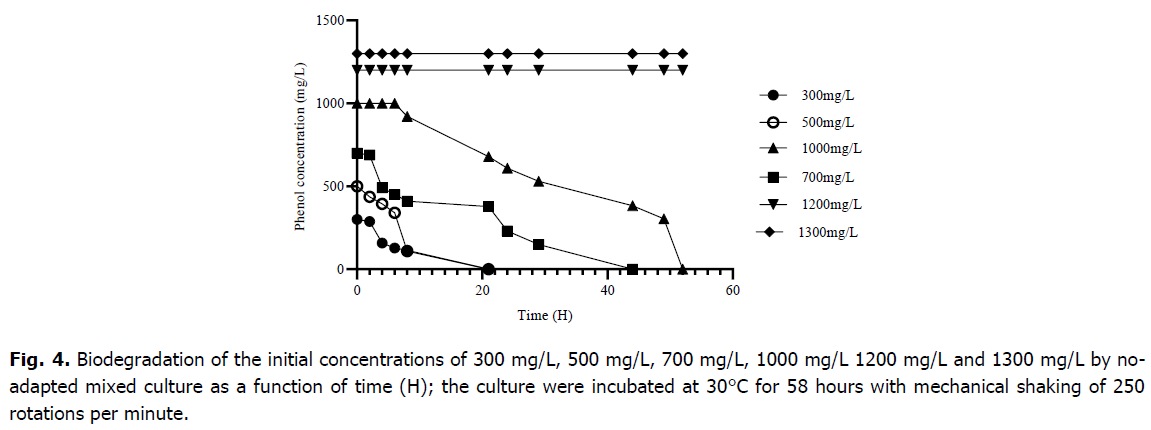
Fig 4. Biodegradation of the initial concentrations of 300 mg/L, 500 mg/L, 700 mg/L, 1000 mg/L 1200 mg/L and 1300 mg/L by noadapted mixed culture as a function of time (H); the culture were incubated at 30°C for 58 hours with mechanical shaking of 250 rotations per minute.
Effect of successive adaptation on the degradation of high concentration of phenol Biodegradation of 1000 mg/L
As shown in Fig. 5, following pre-adaptation at 300 mg/L, 500 mg/L, and 700 mg/L cells began biodegradation immediately without requiring adaptation time (lag phase), but non-adapted cells needed 7 hours to start metabolization, respectively. After 8 hours of incubation, cells that had already adapted to 300 mg/L consumed 35.85 ± 4.16 (%) of phenol, cells that have since adapted to 500 mg/L consumed 41.07 ± 5.56 (%), and cells which had already adapted to 700 mg/L degraded 24.54 ± 4.33 (%); however, after 8 hours, cells that had not received any pre-adaptation metabolized only 3.94 ± 3.6 (%) of phenol. After 24 hours of incubation, the biomass that had previously adapted to 300 mg/L, 500 mg/L and 700 mg/L had entirely used the initial concentration of phenol, although the biomass that had not adapted had consumed almost half of it at a rate of 49.48 ± 10.88 (%). The result of the one-way ANOVA and test The Tukey’s multiple comparison tests revealed that there is no significant effect of the level of adaptation for the metabolization of 1000 mg/L by the mixed culture of Bacillus sp., Pseudomonas sp. and Micrococcus sp. with (p-value=0.1114).
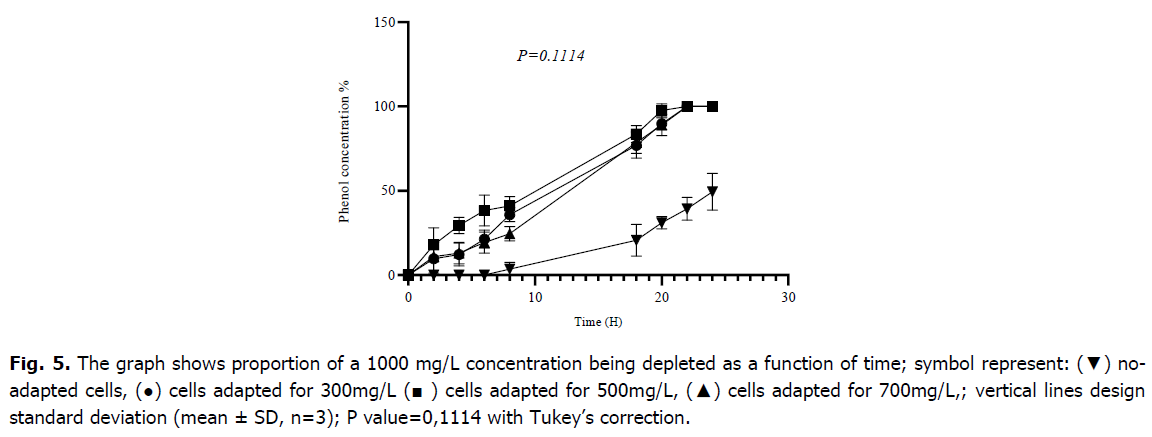
Fig 5. The graph shows proportion of a 1000 mg/L concentration being depleted as a function of time; symbol represent: (▼) noadapted cells, (●) cells adapted for 300mg/L (■ ) cells adapted for 500mg/L, (▲) cells adapted for 700mg/L,; vertical lines design standard deviation (mean ± SD, n=3); P value=0,1114 with Tukey’s correction.
Biodegradation of 1200 mg/L
After two successive adaptations, the mixed culture of Bacillus sp., Pseudomonas sp. and Micrococcus sp. was able to begin the degradation of 1200 mg/L of phenol; the starting point of adaptation is always a relatively low concentration, cells that have not been adapted are unable to begin the metabolization of this concentration of phenol as indicated in Fig. 6; those which followed the route 300→1000 degraded 93.64 ± 5.52 (%), cells of the route 500→1000 metabolized 100 (%), cells of the route 700→1000 degraded 95.02 ± 4.43 (%) and those adapted to 1000 degraded 86.97 ± 3.65 (%) of phenol after 20 hours of incubation, respectively. The analysis of variance (ANOVA) indicated that there is a highly statically difference between all cultures of adapted and no-adapted cells with a P-value of (0.0008). the results of the Tukey multiple comparison provide that are a significant difference between the means of values obtained of suitable and non-suitable cultures for degradation of 1200 mg/L, however the start adaptation stages at low concentrations showed no significant difference between them with p-values>0.05 as indicated (Table 2).
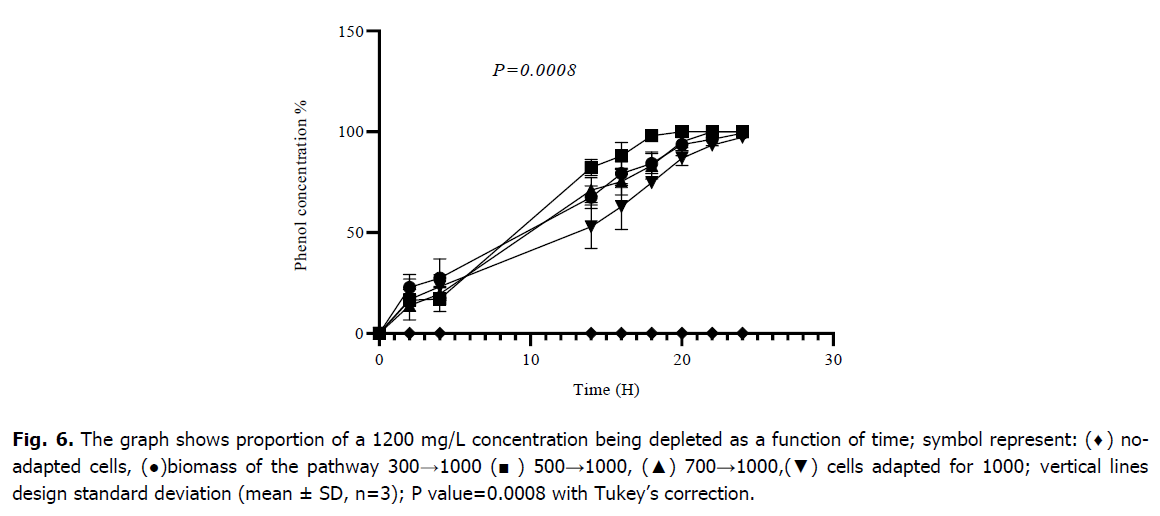
Fig 6. The graph shows proportion of a 1200 mg/L concentration being depleted as a function of time; symbol represent: (♦) noadapted cells, (●)biomass of the pathway 300→1000 (■) 500→1000, (▲) 700→1000,(▼) cells adapted for 1000; vertical lines design standard deviation (mean ± SD, n=3); P value=0.0008 with Tukey’s correction.
| Components | Comparison model | Mean Diff | q | Summary | P-value |
|---|---|---|---|---|---|
| Biodegradation of an initial concentration of 1000 mg/L |
A-B | -6.937 | 0.5646 | ns | 0.9781 |
| A-C | 1.112 | 0.09049 | ns | >0.999 | |
| A-D | 33.51 | 2,727 | ns | 0.2366 | |
| B-C | 8.049 | 0.6551 | ns | 0.9665 | |
| B-D | 40.45 | 3.292 | ns | 0.1128 | |
| C-D | 32.40 | 2.637 | ns | 0.2632 | |
| Biodegradation of an initial concentration of 1200 mg/L | A-B | -3.453 | 0.2982 | ns | 0.9995 |
| A-C | 1.408 | 0.1216 | ns | >0.999 | |
| A-D | 6.914 | 0.5970 | ns | 0.9931 | |
| A-E | 63.42 | 5.476 | ** | 0.0034 | |
| B-C | 4.862 | 0.4198 | ns | 0.9982 | |
| B-D | 10.37 | 0.8952 | ns | 0.9688 | |
| B-E | 66.87 | 5.774 | ** | 0.0018 | |
| C-D | 5.506 | 0.4754 | ns | 0.9971 | |
| C-E | 62.01 | 5.354 | ** | 0.0043 | |
| D-E | 56.50 | 4.879 | * | 0.0110 | |
| Biodegradation of an initial concentration of 1300 mg/L | A-B | -6.210 | 0.5864 | ns | 0.9936 |
| A-C | 3.616 | 0.3415 | ns | 0.9992 | |
| A-D | 15.42 | 1.456 | ns | 0.8405 | |
| A-E | 60.05 | 5.671 | ** | 0.0018 | |
| B-C | 9.825 | 0.9278 | ns | 0.9647 | |
| B-D | 21.63 | 2.042 | ns | 0.6027 | |
| B-E | 66.26 | 6.257 | *** | 0.0005 | |
| C-D | 11.80 | 1.115 | ns | 0.9329 | |
| C-E | 56.44 | 5.330 | ** | 0.0038 | |
| D-E | 44.64 | 4.215 | * | 0.0343 |
Table 2. The results of Tukey’s multiple comparisons test of different samples of degradation of high concentrations of phenol.
Biodegradation of 1300 mg/L
The results obtained during the study of the biodegradation of 1300 mg/L, as plotted in Fig. 7, showed a record time of 22 hours for the cells that underwent the pathway 500→1000→1200, on the other hand, the cells which had already taken the route 300→1000→1200 and those taken 700→1000→1200 showed less rapidity and a longer time noted 46 hours for a complete degradation, and an even longer and incomplete degradation for cells pre-adapted to 1000→1200, this takes almost 50 hours. After 24 hours of incubation, the biomass corresponding to route 300→1000→1200 has metabolized 61.72 ± 5.38 (%), 500→1000→1200 has metabolized 96.43 ± 4.50 (%), 700→1000→1200 has metabolized 71.60 ± 3.69 (%), and 1000→1200 has metabolized 48.87 ± 3.26 (%) of phenol. A one-way ANOVA gave a significant difference between all different cultures marked P=0.0003, the difference is due to the time of full degradation between the adapted and non-adapted cells and the rate of degraded phenol at each reading time. The Tukey’s multiple comparisons (Table 2) revealed that there is not a significant difference between the different routes of low concentrations with values of P-value>0.9999, on either hand, there is always a distinction between adapted and non-adapted cultures' values with P-values<0.05.
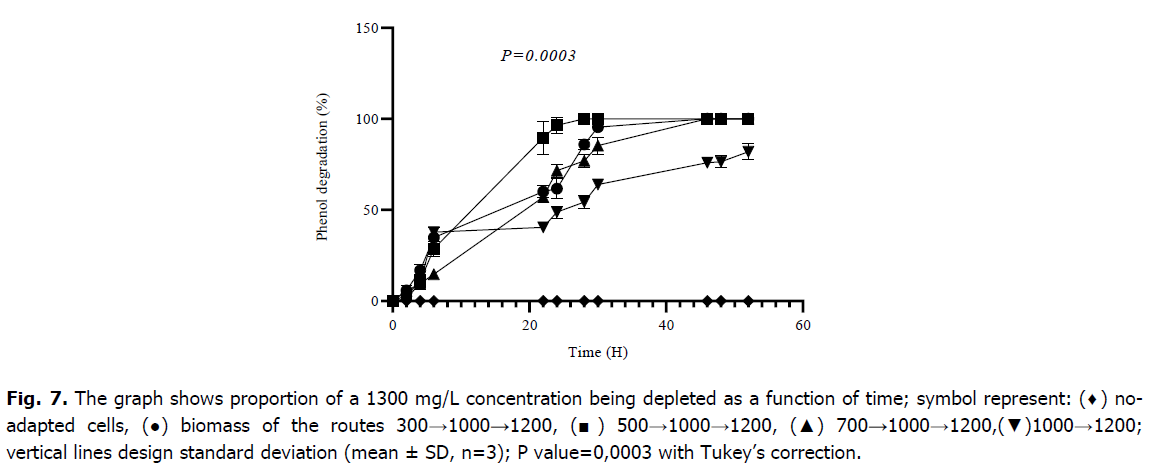
Fig 7. The graph shows proportion of a 1300 mg/L concentration being depleted as a function of time; symbol represent: (♦) noadapted cells, (●) biomass of the routes 300→1000→1200, (■) 500→1000→1200, (▲) 700→1000→1200,(▼)1000→1200; vertical lines design standard deviation (mean ± SD, n=3); P value=0,0003 with Tukey’s correction.
Discussion
Soils are known for their enormous microbial biodiversity, in particular soils polluted by hydrocarbons, which makes up a suitable choice of isolating microbial strains capable of degrading organic pollutants such as phenols (Zhang et al., 2004); This degradation occurs under a variety of physical-chemical conditions, several degrading bacteria develop under the same temperature and pH fluctuations, as reported in the literature. (Bajaj et al., 2009; Mishra and Kumar et al., 2017; Singh et al., 2020). However, enzymes catalyze specific reactions and especially exploit under moderate conditions of temperature, pH, solvents and ionic strength (Pradeep et al., 2015). The most common bacteria detected in biodegradation of phenols belonging to the gram negative and gram positive genera with a dominance of gram positive genera, the bacterial species mostly found in degradation of phenol are: Pseudomonas sp, Bacillus sp, Achromobacter sp, Acinetobacter sp, …etc., and fungal species: Fusarium sp, Streptomyces sp, Phanerocheate chrysosporium, Ralstonia sp, Corious versicolor, … Etc (Nair et al., 2008).
Multiple works and studies have shown a high performance of pollutant degradation by mixed cultures compared to single cultures (Prpich and Daugulis, 2005; Pradhan et al., 2012; Barman et al., 2017), However, polycyclic aromatic hydrocarbons (PAH) have been digested by a consortium of bacteria combining Bacillus, Pseudomonas, and Micrococcus (Ifeanyi and Ihenatuoha, 2011), Several Pseudomonas and Bacillus species have exhibited strong phenol tolerance, Pseudomonas space and Bacillus brevis, both isolated from wastewater, reduced up to 2500 and 1750 mg l 1 of phenol in 144 hours, respectively (Arutchelvan et al., 2005).
Nevertheless, the use of mixed culture in the biodegradation of high concentrations of phenol can be advantageous for several reasons, accessibility of a large initial carbon source elicit competition between microbial populations which triggers a rapid decline of this source, in addition, this degradation process can be ensured under a wide variety of pH and temperature due to microbial heterogenicity then it does not require a fixed initial pH at the start and change of pH during the degradation reactions can be easily supported by another tolerant species (Zache and Rehm, 1989).
A bacterial consortium constituting of two strains of pseudomonas sp and two strains of Acinitobacter sp has degraded a concentration which exceeds 2000 mg/L with decreased lag time (10H) and increase in the rate of degradation of phenol (Prpich and Daugulis, 2005); Another consortium isolated from refinery wastewater consisting primarily of Streptococci sp degraded up to 1000 mg/L at 37°C and pH 7 going through a lag phase marked 48H, while concentrations less than 200 mg/L had no inhibitory effect on cell growth (Pradhan et al., 2012).
According to the work of Kyung Han know et al., (2009) phenol catabolism has two stages, a period of cellular adaptation linked by a period of degradation, for microorganisms the adaptation period serves to prepare the enzymatic machinery, and may change the membrane structure to protect themselves from substrate toxicity (Heipieper et al., 1994).
It should be noted that our results are almost similar to the results of Kyung Han know et al., (2009); while considering that our bacteria strains already no adapted and degradation times of Pseudomonas fluorescence KN417 adapted to 100 mg/L have almost the same times of growth for complete degradation Kyung Han Kwon et al analyzed that the degradation of less concentrations requires a pre-adaptation, against the degradation of very high concentrations necessarily require at least two pre-adaptations while pre-adaptations at the same concentration do not have a considerable influence on the rate of degradation; Pseudomonas fluorescence KNU417 was able to degrade up to 1300 mg/L after pre-adaptation to 100 mg/L then to 700 mg/L, while our mixed culture was able to metabolize 1300 mg/L in 24 hours after route 500→1000, while the passage through the 500 mg/L, 300 mg/L and 700 mg/L concentrations present significant results; from these two almost similar results we can deduce that the range of 300 mg/L to 700 mg/L have an optimal concentrations for better adaptation.
To gain understanding into the mechanism underlying tolerance in bacteria and phenol toxicity, Santos et al., (2004) made a reference protein carte which illustrate the structural and metabolic changes induced in pseudomonas putida KT2440 exposed to two concentrations of phenol 600 mg/L and 800 mg/L, showed inhibition of at least 4 hours before resumption of cell growth; this sudden exposure to these two concentrations results in increased expression of 68 proteins; these proteins are involved in the oxidative stress response, general stress response, energy metabolism, fatty acid biosynthesis, inhibition of cell division, cell envelope biosynthesis, transcription regulation and transport of protein molecules; on the other hand 13 reduced proteins involved in nucleotide biosynthesis and cell mobility these strategies adopted by pseudomonas putida gave it a high tolerance to phenols. Burkholderia sp was able to develop after a long adaptation to a relatively high concentration of phenol (1500 mg/L) and exhibited changes over time from unadapted cells before the addition of phenol. Among the mechanism of adaptations, were an evolutionary process which went from tolerance to rapid degradation after the expression of a specific gene more precisely, the expression of basal stress genes, DNA repair, the efflux pump, membrane, and genes encoding antioxidant proteins (Ma.Y et al., 2020).
The permeability of the cell membrane for phenol increases with the increase in the concentration of phenol which exceeds 1g/L and the size of the inoculum has no relation with cell degradation (Shahryari et al., 2018), from these data, it is concluded that cellular adaptation mechanism involves tolerance to rapid positive degradation. Nonetheless, accelerated positive degradation has been explained by production of catalic enzymes of metabolization, notably phenol hydroxylase (PH) and catechol 2,3-dioxygenase (C23O).
The work of Arai et al., in 1998 suggests that phenol was degraded by a strain of Comamonas testosteroni adapted via meta-path induced by structural genes encoding multicomponent PH and C23O and a divergently transcribed regulatory gene (aphR). It has been described previously that the degradation of phenol also comprises the ortho-cleavage pathway by the activity of catechol 1,2- dioxygenase (12DO); however, the action of these two enzymes increases significantly the rate of degradation of phenol. In the previous study, Pseudomonas fluorescence KNU417 was found to use ortho-cleavage, the level of CD12O detected is essentially dependent on the two stages of degradation and the initial concentration of phenol, no enzymatic activity at the start of degradation, very high activity in the middle and a decrease activity at the end of degradation. pseudomonas degraded 1000 mg/L in 20 h by cells adapted to 300 mg/L and 500 mg/L while cells preadapted to 100 mg/L degraded 1000 mg/L in 40h, on this we conclude that the cells need a period of adaptation for an enzymatic activity adequate to cross the threshold, knowing that adaptation to high concentrations is mandatory to cross the high pollutant thresholds (Kwon et al., 2009). In aerobic conditions, the ortho or meta cleavage pathway depended on the type of bacteria, catechols then incur circle cleavage at the ortho position, starting the ortho pathway for the formation of acetyl Co-A and succinyl Co-A, or at the meta position, starting the meta pathway for the formation of acetaldehyde and pyruvate (Singh et al., 2020). More robust research's needs to be suggested to conceived more logically catalytic enzyme reactions responsible for phenol transformation and degradation, before, during and after cells adaptation.
Conclusion
Bacteria are the most commonly used microorganisms in decontamination processes, and soil is considered a better support for isolation of these microorganisms, especially soils polluted by hydrocarbons, oil and its derivatives, industrial waste, and so on, because of their great ability to biodegrade organic pollutants. In the current study, 3 bacterial strains of interest were isolated from a polluted soils of an oil field in the region of Hassi Messaoud, Algeria identified Bacillus sp., Pseudomonas sp. and Micrococcus sp. the mixed culture made up of these 3 bacterial strains showed great efficiency in degrading phenol under standardized physical-chemical conditions. Within the same consortium, there was a considerable difference in degradation durations; this difference is connected to the biodegradation pathway, with no-adapted cells, the mixed culture was able to breakdown relatively low degrees of phenol, but high stages of substrate needed several pre-adaptations. We can conclude that the bacteria's sequential pre-adaptations provide maximal tolerance to high levels of phenol. The consortium can be employed in biological procedures for environmental remediation. Our strains of Bacillus sp, Pseudomonas sp and Micrococcus sp must be identified at the molecular scale by the sequencing of RNA 16S gene, moreover as test its ability to degrade other organic pollutants such as benzene, toluene...etc. In addition, an enzyme extraction is planned to determine the type and structure of enzymes engaged in the degradation process, along with their timing, in order to gain a complete and logical knowledge of what happens during biodegradation.
Acknowledgment
We are grateful to the laboratory of Biology department and Agronomy department for their kind collaboration. The Algerian General Directorate of Scientific Research and Technological Development (DGRSDT) provided support for this project.
References
Abarian, M., Hassanshahian, M., Esbah, A. (2019). Degradation of phenol at high concentrations using immobilization of Pseudomonas putida P53 into sawdust entrapped in sodium-alginate beads. Water Science and Technology, 79:1387-1396.
Anupama, S., Pradeep, N.V., Hampannavar, U.S. (2013). Anaerobic followed by aerobic treatment approaches for Spentwash using MFC and RBC. Sugar Tech, 15:197-202.
Arai, H., Akahira, S., Ohishi, T., Maeda, M., Kudo, T. (1998). Adaptation of cornamonas testosteroni TAM1 to utilize phenol: organization and regulation of the genes involved in phenol degradatio. Microbiology, 144:2895-2903.
Arutchelvan, V., Kanakasabai, V., Nagarajan, S., Muralikrishnan, V. (2005). Isolation and identification of novel high strength phenol degrading bacterial strains from phenol-formaldehyde resin manufacturing industrial wastewater. Journal of Hazardous Materials, 127:238-243.
Bajaj, M., Gallert, C., Winter, J. (2009). Phenol degradation kinetics of an aerobic mixed culture. Biochemical Engineering Journal, 46:205-209.
Barman, P., Raut, S., Sen, S.K., Shaikh, U., Bandyopadhyay, P., Mohapatra, P.K.D. (2017). Effect of a three-component bacterial consortium in white shrimp farming for growth, survival and water quality management. Acta Biologica Szegediensis, 61:35-44.
Basak, B., Jeon, B.H., Kurade, M.B., Saratale, G.D., Bhunia, B., Chatterjee, P.K., Dey, A. (2019). Biodegradation of high concentration phenol using sugarcane bagasse immobilized Candida tropicalis PHB5 in a packed-bed column reactor. Ecotoxicology and Environmental Safety, 180:317-325.
Bergery, D. (1974). Manual of determinative bacteriology. Williams and Wilkins Company.
Busca, G., Berardinelli, S., Resini, C., Arrighi, L. (2008). Technologies for the removal of phenol from fluid streams: a short review of recent developments. Journal of Hazardous Materials, 160:265-288.
Der Yang, R., Humphrey, A.E. (1975). Dynamic and steady state studies of phenol biodegradation in pure and mixed cultures. Biotechnology and Bioengineering, 17:1211-1235.
González-Muñoz, M.J., Luque, S., Alvarez, J.R., Coca, J. (2003). Recovery of phenol from aqueous solutions using hollow fibre contactors. Journal of Membrane Science, 213:181-193.
Heipieper, H.J., Weber, F.J., Sikkema, J., Keweloh, H., de Bont, J.A. (1994). Mechanisms of resistance of whole cells to toxic organic solvents. Trends in Biotechnology, 12:409-415.
Ifeanyi, V.O., Ihenatuoha, U.A. (2011). Effects of the consortium of pseudomonas, bacillus and micrococcus spp on polycyclic aromatic hydrocarbons in crude oil. Nigerian Journal of Biotechnology, 22:28-33.
Jiang, Y., Wen, J., Bai, J., Jia, X., Hu, Z. (2007). Biodegradation of phenol at high initial concentration by Alcaligenes faecalis. Journal of Hazardous Materials, 147:672-676.
Kumaran, P., Paruchuri, Y.L. (1997). Kinetics of phenol biotransformation. Water Research, 31:11-22.
Kwon, K.H., Yeom, S.H. (2009). Optimal microbial adaptation routes for the rapid degradation of high concentration of phenol. Bioprocess and Biosystems Engineering, 32:435-442.
Li, H., Meng, F., Duan, W., Lin, Y., Zheng, Y. (2019). Biodegradation of phenol in saline or hypersaline environments by bacteria: A review. Ecotoxicology and Environmental Safety, 184:109658.
Loh, K.C., Tan, C.P. (2000). Effect of additional carbon sources on biodegradation of phenol. Bulletin of Environmental Contamination and Toxicology, 64:756-763.
Margesin, R., Bergauer, P., Gander, S. (2004). Degradation of phenol and toxicity of phenolic compounds: a comparison of cold-tolerant Arthrobacter sp. and mesophilic Pseudomonas putida. Extremophiles, 8:201-207.
Marrot, B., Barrios, M.A., Moulin, P., Roche, N. (2005). Experimental study of mass transfer phenomena in a cross flow membrane bioreactor: aeration and membrane separation. Engineering in Life Sciences, 5:409-414.
Mishra, V.K., Kumar, N. (2017). Microbial degradation of phenol: A Review. Journal of Water Pollution and Purification Research, 4:2394-7306.
Nair, C.I., Jayachandran, K., Shashidhar, S. (2008). Biodegradation of phenol. African Journal of Biotechnology, 7:1684-5315.
Pradeep, N.V., Anupama, S., Navya, K., Shalini, H.N., Idris, M., Hampannavar, U.S. (2015). Biological removal of phenol from wastewaters: A mini review. Applied Water Science, 5:105-112.
Pradhan, B., Murugavelh, S., Mohanty, K. (2012). Phenol biodegradation by indigenous mixed microbial consortium: growth kinetics and inhibition. Environmental Engineering Science, 29:86-92.
Prpich, G.P., Daugulis, A.J. (2005). Enhanced biodegradation of phenol by a microbial consortium in a solid-liquid two phase partitioning bioreactor. Biodegradation, 16:329-339.
Santos, P.M., Benndorf, D., Sá‐Correia, I. (2004). Insights into Pseudomonas putida KT2440 response to phenol‐induced stress by quantitative proteomics. Proteomics, 4:2640-2652.
Shahryari, S., Zahiri, H.S., Haghbeen, K., Adrian, L., Noghabi, K.A. (2018). High phenol degradation capacity of a newly characterized Acinetobacter sp. SA01: bacterial cell viability and membrane impairment in respect to the phenol toxicity. Ecotoxicology and Environmental Safety, 164:455-466.
Singh, T., Bhatiya, A.K., Mishra, P.K., Srivastava, N. (2020). An effective approach for the degradation of phenolic waste: phenols and cresols. In Abatement of Environmental Pollutants Elsevier, pp:203-243.
Subramaniam, K., Ahmad, S.A., Shaharuddin, N.A. (2020). Mini review on phenol biodegradation in Antarctica using native microorganisms. Asia Pacific Journal of Molecular Biology and Biotechnolgy, 28:77-89.
Ucun, H., Yildiz, E., Nuhoglu, A. (2010). Phenol biodegradation in a batch jet loop bioreactor (JLB): Kinetics study and pH variation. Bioresource Technology, 101:2965-2971.
Wang, W., Han, H., Yuan, M., Li, H., Fang, F., Wang, K. (2011). Treatment of coal gasification wastewater by a two-continuous UASB system with step-feed for COD and phenols removal. Bioresource Technology, 102:5454-5460.
Yeom, S.H., Kim, S.H., Yoo, Y.J., Yoo, I.S. (1997). Microbial adaptation in the degradation of phenol by Alcaligenes xylosoxidans Y234. Korean Journal of Chemical Engineering, 14:37-40.
Yinghui, Ma., Lijun, Li., Mukesh Kumar, A., Haixia, T., Meihuan, L., Mallavarapu, M., Yalei, P., Wenxiang, H. (2020). Time-course transcriptome analysis reveals the mechanisms of Burkholderia sp. adaptation to high phenol concentrations. Applied Microbiology and Biotechnology.
Zache, G., Rehm, H.J. (1989). Degradation of phenol by a coimmobilized entrapped mixed culture. Applied Microbiology and Biotechnology, 30:426-432.
Zhang, H., Kallimanis, A., Koukkou, A.I., Drainas, C. (2004). Isolation and characterization of novel bacteria degrading polycyclic aromatic hydrocarbons from polluted Greek soils. Applied Microbiology and Biotechnology, 65:124-131.
Zhao, G., Li, Y., Liu, X., Liu, X. (2010). Preparation of capsules containing 1-nonanol for rapidly removing high concentration phenol from aqueous solution. Journal of Hazardous Materials, 175:715-725.
Author Info
A. Rezzoug1*, F. Benaceur1,2, H. Gouzi1, I. Messahli1, L. Rouari1, L. Hamida1, M. Labiodh1, M. Halifa1 and R. Chaibi12Research Unit of Medicinal Plant (RUMP, 3000 Laghouat) Attached to Center of Biotechnology (CRBt, 3000, Constantine), Algeria
Citation: Rezzoug, A., Benaceur, F., Gouzi, H., Messahli, I., Rouari, L., Hamida, L., Labiodh, M., Halifa, M., Chaibi, R. (2022). Effect of successive adaptations on the metabolization of phenol by a consortium isolated from polluted soils of an oil field in Algeria. Ukrainian Journal of Ecology. 12: 31-39.
Received: 04-Jan-2022, Manuscript No. UJE-22-51203; Accepted: 25-Jan-2022, Pre QC No. P-51203; Editor assigned: 06-Jan-2022, Pre QC No. P-51203; Reviewed: 16-Jan-2022, QC No. Q-51203; Revised: 20-Jan-2022, Manuscript No. R-51203; Published: 03-Feb-2022, DOI: 10.15421/2022_332
Copyright: This is an open access article distributed under the terms of the Creative Commons Attribution License, which permits unrestricted use, distribution, and reproduction in any medium, provided the original work is properly cited.
